
Page 273 - Modern Analytical Chemistry
P. 273
1400-CH08 9/9/99 2:18 PM Page 256
256 Modern Analytical Chemistry
25.00
20.00
Mass (mg) 15.00
10.00
5.00
0.00
Figure 8.9 0 100 200 300 400 500 600 700 800 900 1000
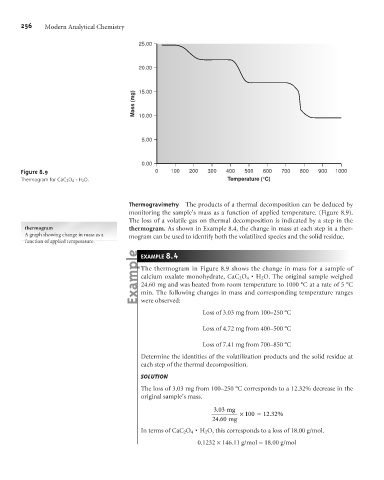
Thermogram for CaC 2 O 4× H 2 O. Temperature (°C)
Thermogravimetry The products of a thermal decomposition can be deduced by
monitoring the sample’s mass as a function of applied temperature. (Figure 8.9).
The loss of a volatile gas on thermal decomposition is indicated by a step in the
thermogram thermogram. As shown in Example 8.4, the change in mass at each step in a ther-
A graph showing change in mass as a mogram can be used to identify both the volatilized species and the solid residue.
function of applied temperature.
EXAMPLE 8. 4
The thermogram in Figure 8.9 shows the change in mass for a sample of
H
calcium oxalate monohydrate, CaC 2 O 4×2 O. The original sample weighed
24.60 mg and was heated from room temperature to 1000 °C at a rate of 5 °C
min. The following changes in mass and corresponding temperature ranges
were observed:
Loss of 3.03 mg from 100–250 °C
Loss of 4.72 mg from 400–500 °C
Loss of 7.41 mg from 700–850 °C
Determine the identities of the volatilization products and the solid residue at
each step of the thermal decomposition.
SOLUTION
The loss of 3.03 mg from 100–250 °C corresponds to a 12.32% decrease in the
original sample’s mass.
303 mg
.
´ 100 = 12 32.%
.
24 60 mg
In terms of CaC 2 O 4×2 O, this corresponds to a loss of 18.00 g/mol.
H
0.1232 ´146.11 g/mol = 18.00 g/mol