
Page 288 - Modern Analytical Chemistry
P. 288
1400-CH08 9/9/99 2:18 PM Page 271
Chapter 8 Gravimetric Methods of Analysis 271
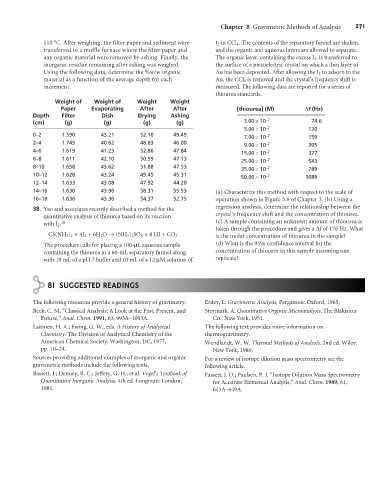
110 °C. After weighing, the filter paper and sediment were I 2 in CCl 4 . The contents of the separatory funnel are shaken,
transferred to a muffle furnace where the filter paper and and the organic and aqueous layers are allowed to separate.
any organic material were removed by ashing. Finally, the The organic layer, containing the excess I 2 , is transferred to
inorganic residue remaining after ashing was weighed. the surface of a piezoelectric crystal on which a thin layer of
Using the following data, determine the %w/w organic Au has been deposited. After allowing the I 2 to adsorb to the
material as a function of the average depth for each Au, the CCl 4 is removed and the crystal’s frequency shift is
increment. measured. The following data are reported for a series of
thiourea standards.
Weight of Weight of Weight Weight
Paper Evaporating After After [thiourea] (M) Df (Hz)
Depth Filter Dish Drying Ashing
(cm) (g) (g) (g) (g) 3.00 ´10 –7 74.6
5.00 ´10 –7 120
0–2 1.590 43.21 52.10 49.49 –7
7.00 ´10 159
2–4 1.745 40.62 48.83 46.00 –7
9.00 ´10 205
4–6 1.619 41.23 52.86 47.84 –7
15.00 ´10 327
6–8 1.611 42.10 50.59 47.13 –7
25.00 ´10 543
8–10 1.658 43.62 51.88 47.53 –7
35.00 ´10 789
10–12 1.628 43.24 49.45 45.31 –7
50.00 ´10 1089
12–14 1.633 43.08 47.92 44.20
14–16 1.630 43.96 58.31 55.53 (a) Characterize this method with respect to the scale of
16–18 1.636 43.36 54.37 52.75 operation shown in Figure 3.6 of Chapter 3. (b) Using a
38. Yao and associates recently described a method for the regression analysis, determine the relationship between the
quantitative analysis of thiourea based on its reaction crystal’s frequency shift and the concentration of thiourea.
with I 2 . 18 (c) A sample containing an unknown amount of thiourea is
taken through the procedure and gives a Df of 176 Hz. What
CS(NH 2 ) 2 +4I 2 +6H 2 O ® (NH 4 ) 2 SO 4 +8 HI+CO 2 is the molar concentration of thiourea in the sample?
The procedure calls for placing a 100-mL aqueous sample (d) What is the 95% confidence interval for the
containing the thiourea in a 60-mL separatory funnel along concentration of thiourea in this sample assuming one
with 10 mL of a pH 7 buffer and 10 mL of a 12 mM solution of replicate?
8I SUGGESTED READINGS
The following resources provide a general history of gravimetry. Erdey, L. Gravimetric Analysis, Pergamon: Oxford, 1965.
Beck, C. M. “Classical Analysis: A Look at the Past, Present, and Steymark, A. Quantitative Organic Microanalysis, The Blakiston
Future,” Anal. Chem. 1991, 63, 993A–1003A. Co.: New York, 1951.
Laitinen, H. A.; Ewing, G. W., eds. A History of Analytical The following text provides more information on
Chemistry. The Division of Analytical Chemistry of the thermogravimetry.
American Chemical Society: Washington, DC, 1977, Wendlandt, W. W. Thermal Methods of Analysis, 2nd ed. Wiley:
pp. 10–24. New York, 1986.
Sources providing additional examples of inorganic and organic For a review of isotope dilution mass spectrometry see the
gravimetric methods include the following texts. following article.
Bassett, J.; Denney, R. C.; Jeffery, G. H.; et al. Vogel’s Textbook of Fassett, J. D.; Paulsen, P. J. “Isotope Dilution Mass Spectrometry
Quantitative Inorganic Analysis, 4th ed. Longman: London, for Accurate Elemental Analysis,” Anal. Chem. 1989, 61,
1981. 643A–649A.