
Page 293 - Modern Analytical Chemistry
P. 293
1400-CH09 9/9/99 2:12 PM Page 276
276 Modern Analytical Chemistry
14.00
12.00
10.00
8.00
pH Equivalence point
6.00
4.00
2.00
Figure 9.1 0.00
0.00 10.00 20.00 30.00 40.00 50.00
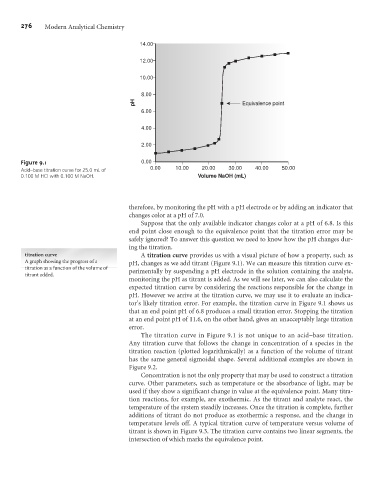
Acid–base titration curve for 25.0 mL of
0.100 M HCl with 0.100 M NaOH. Volume NaOH (mL)
therefore, by monitoring the pH with a pH electrode or by adding an indicator that
changes color at a pH of 7.0.
Suppose that the only available indicator changes color at a pH of 6.8. Is this
end point close enough to the equivalence point that the titration error may be
safely ignored? To answer this question we need to know how the pH changes dur-
ing the titration.
titration curve A titration curve provides us with a visual picture of how a property, such as
A graph showing the progress of a pH, changes as we add titrant (Figure 9.1). We can measure this titration curve ex-
titration as a function of the volume of perimentally by suspending a pH electrode in the solution containing the analyte,
titrant added.
monitoring the pH as titrant is added. As we will see later, we can also calculate the
expected titration curve by considering the reactions responsible for the change in
pH. However we arrive at the titration curve, we may use it to evaluate an indica-
tor’s likely titration error. For example, the titration curve in Figure 9.1 shows us
that an end point pH of 6.8 produces a small titration error. Stopping the titration
at an end point pH of 11.6, on the other hand, gives an unacceptably large titration
error.
The titration curve in Figure 9.1 is not unique to an acid–base titration.
Any titration curve that follows the change in concentration of a species in the
titration reaction (plotted logarithmically) as a function of the volume of titrant
has the same general sigmoidal shape. Several additional examples are shown in
Figure 9.2.
Concentration is not the only property that may be used to construct a titration
curve. Other parameters, such as temperature or the absorbance of light, may be
used if they show a significant change in value at the equivalence point. Many titra-
tion reactions, for example, are exothermic. As the titrant and analyte react, the
temperature of the system steadily increases. Once the titration is complete, further
additions of titrant do not produce as exothermic a response, and the change in
temperature levels off. A typical titration curve of temperature versus volume of
titrant is shown in Figure 9.3. The titration curve contains two linear segments, the
intersection of which marks the equivalence point.