
Page 295 - Modern Analytical Chemistry
P. 295
1400-CH09 9/9/99 2:12 PM Page 278
278 Modern Analytical Chemistry
9
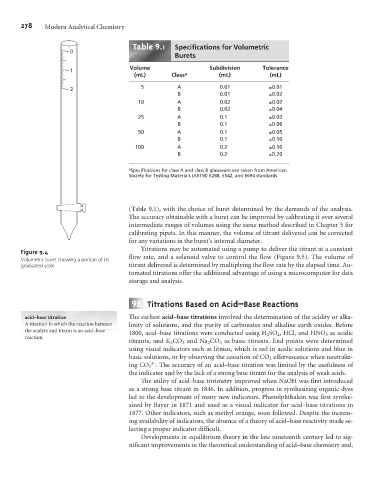
Table .1 Specifications for Volumetric
0
Burets
Volume Subdivision Tolerance
1
(mL) Class a (mL) (mL)
2 5 A 0.01 ±0.01
B 0.01 ±0.02
10 A 0.02 ±0.02
B 0.02 ±0.04
25 A 0.1 ±0.03
B 0.1 ±0.06
50 A 0.1 ±0.05
B 0.1 ±0.10
100 A 0.2 ±0.10
B 0.2 ±0.20
a Specifications for class A and class B glassware are taken from American
Society for Testing Materials (ASTM) E288, E542, and E694 standards.
(Table 9.1), with the choice of buret determined by the demands of the analysis.
The accuracy obtainable with a buret can be improved by calibrating it over several
intermediate ranges of volumes using the same method described in Chapter 5 for
calibrating pipets. In this manner, the volume of titrant delivered can be corrected
for any variations in the buret’s internal diameter.
Titrations may be automated using a pump to deliver the titrant at a constant
Figure 9.4
flow rate, and a solenoid valve to control the flow (Figure 9.5). The volume of
Volumetric buret showing a portion of its
graduated scale. titrant delivered is determined by multiplying the flow rate by the elapsed time. Au-
tomated titrations offer the additional advantage of using a microcomputer for data
storage and analysis.
9 B Titrations Based on Acid–Base Reactions
acid–base titration The earliest acid–base titrations involved the determination of the acidity or alka-
A titration in which the reaction between linity of solutions, and the purity of carbonates and alkaline earth oxides. Before
the analyte and titrant is an acid–base 1800, acid–base titrations were conducted using H 2SO 4, HCl, and HNO 3 as acidic
reaction.
titrants, and K 2 CO 3 and Na 2 CO 3 as basic titrants. End points were determined
using visual indicators such as litmus, which is red in acidic solutions and blue in
basic solutions, or by observing the cessation of CO 2 effervescence when neutraliz-
2–
ing CO 3 . The accuracy of an acid–base titration was limited by the usefulness of
the indicator and by the lack of a strong base titrant for the analysis of weak acids.
The utility of acid–base titrimetry improved when NaOH was first introduced
as a strong base titrant in 1846. In addition, progress in synthesizing organic dyes
led to the development of many new indicators. Phenolphthalein was first synthe-
sized by Bayer in 1871 and used as a visual indicator for acid–base titrations in
1877. Other indicators, such as methyl orange, soon followed. Despite the increas-
ing availability of indicators, the absence of a theory of acid–base reactivity made se-
lecting a proper indicator difficult.
Developments in equilibrium theory in the late nineteenth century led to sig-
nificant improvements in the theoretical understanding of acid–base chemistry and,