
Page 296 - Modern Analytical Chemistry
P. 296
1400-CH09 9/9/99 2:12 PM Page 279
Chapter 9 Titrimetric Methods of Analysis 279
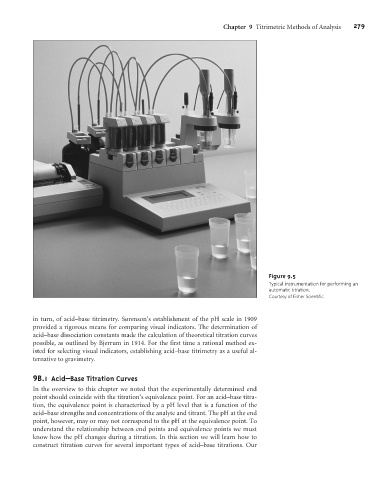
Figure 9.5
Typical instrumentation for performing an
automatic titration.
Courtesy of Fisher Scientific.
in turn, of acid–base titrimetry. Sørenson’s establishment of the pH scale in 1909
provided a rigorous means for comparing visual indicators. The determination of
acid–base dissociation constants made the calculation of theoretical titration curves
possible, as outlined by Bjerrum in 1914. For the first time a rational method ex-
isted for selecting visual indicators, establishing acid–base titrimetry as a useful al-
ternative to gravimetry.
9 B.1 Acid–Base Titration Curves
In the overview to this chapter we noted that the experimentally determined end
point should coincide with the titration’s equivalence point. For an acid–base titra-
tion, the equivalence point is characterized by a pH level that is a function of the
acid–base strengths and concentrations of the analyte and titrant. The pH at the end
point, however, may or may not correspond to the pH at the equivalence point. To
understand the relationship between end points and equivalence points we must
know how the pH changes during a titration. In this section we will learn how to
construct titration curves for several important types of acid–base titrations. Our