
Page 298 - Modern Analytical Chemistry
P. 298
1400-CH09 9/9/99 2:12 PM Page 281
Chapter 9 Titrimetric Methods of Analysis 281
9
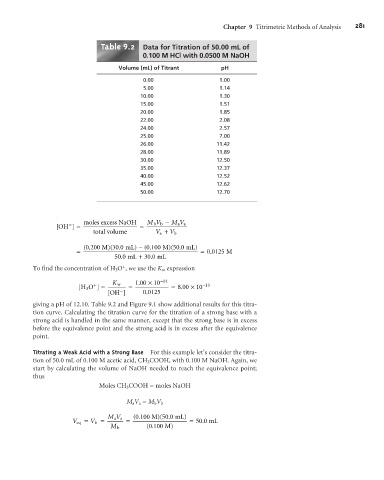
Table .2 Data for Titration of 50.00 mL of
0.100 M HCl with 0.0500 M NaOH
Volume (mL) of Titrant pH
0.00 1.00
5.00 1.14
10.00 1.30
15.00 1.51
20.00 1.85
22.00 2.08
24.00 2.57
25.00 7.00
26.00 11.42
28.00 11.89
30.00 12.50
35.00 12.37
40.00 12.52
45.00 12.62
50.00 12.70
bb -M V
moles excess NaOH MV a a
[OH - ] = =
total volume V a +V b
0
0
50
0
)
0
30
(.200 M )( . mL - (.100 M )( . mL )
= = . 0 0125 M
0
0
50 . mL +30 . mL
+
To find the concentration of H 3 O , we use the K w expression
K w . 100 ´10 - 14
[HO + ] = - = = . 800 ´10 - 13
3
[OH ] . 0 0125
giving a pH of 12.10. Table 9.2 and Figure 9.1 show additional results for this titra-
tion curve. Calculating the titration curve for the titration of a strong base with a
strong acid is handled in the same manner, except that the strong base is in excess
before the equivalence point and the strong acid is in excess after the equivalence
point.
Titrating a Weak Acid with a Strong Base For this example let’s consider the titra-
tion of 50.0 mL of 0.100 M acetic acid, CH 3 COOH, with 0.100 M NaOH. Again, we
start by calculating the volume of NaOH needed to reach the equivalence point;
thus
Moles CH 3 COOH = moles NaOH
M a V a = M b V b
0
50
MV (.100 M)( .0 mL)
aa
V eq = V b = = = .0 mL
50
0
M b (.100 M)