
Page 303 - Modern Analytical Chemistry
P. 303
1400-CH09 9/9/99 2:12 PM Page 286
286 Modern Analytical Chemistry
Before the equivalence point the titrant is the limiting reagent, and the pH
is controlled by a buffer consisting of unreacted acetic acid and its conjugate
weak base, acetate. The pH limits for the buffer region are plotted by
superimposing the ladder diagram for acetic acid on the y-axis (Figure 9.7c)
and adding the appropriate points at 10% (5.0 mL) and 90% (45.0 mL) of the
equivalence point volume.
After the equivalence point the pH is controlled by the concentration of
excess NaOH. Again, we have already done this calculation. Using values from
Table 9.3, we plot two additional points.
An approximate sketch of the titration curve is completed by drawing
separate straight lines through the two points in the buffer region and the two
points in the excess titrant region (Figure 9.7e). Finally, a smooth curve is
drawn connecting the three straight-line segments (Figure 9.7f).
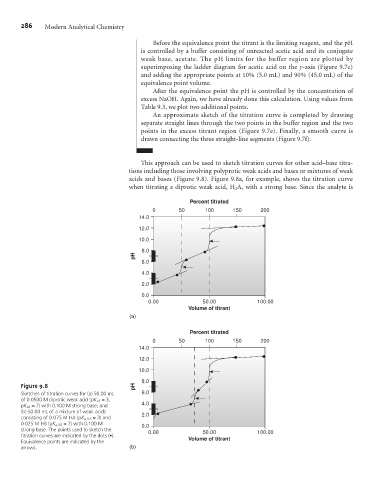
This approach can be used to sketch titration curves for other acid–base titra-
tions including those involving polyprotic weak acids and bases or mixtures of weak
acids and bases (Figure 9.8). Figure 9.8a, for example, shows the titration curve
when titrating a diprotic weak acid, H 2 A, with a strong base. Since the analyte is
Percent titrated
0 50 100 150 200
14.0
12.0
10.0
8.0
pH
6.0
4.0
2.0
0.0
0.00 50.00 100.00
Volume of titrant
(a)
Percent titrated
0 50 100 150 200
14.0
12.0
10.0
8.0
Figure 9.8 pH
Sketches of titration curves for (a) 50.00 mL 6.0
of 0.0500 M diprotic weak acid (pK a1 =3,
pK a2 = 7) with 0.100 M strong base; and 4.0
(b) 50.00 mL of a mixture of weak acids
2.0
consisting of 0.075 M HA (pK a,HA = 3) and
0.025 M HB (pK a,HB = 7) with 0.100 M 0.0
strong base. The points used to sketch the 0.00 50.00 100.00
titration curves are indicated by the dots (•).
Equivalence points are indicated by the Volume of titrant
arrows. (b)