
Page 307 - Modern Analytical Chemistry
P. 307
1400-CH09 9/9/99 2:12 PM Page 290
290 Modern Analytical Chemistry
14.0
12.0
10.0
Phenolphthalein
8.0
pH Bromothymol blue
6.0
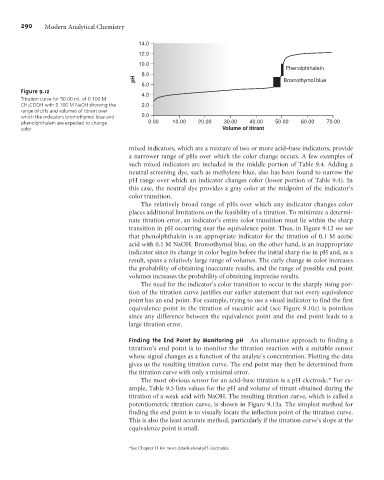
Figure 9.12
4.0
Titration curve for 50.00 mL of 0.100 M
CH 3 COOH with 0.100 M NaOH showing the 2.0
range of pHs and volumes of titrant over
which the indicators bromothymol blue and 0.0
phenolphthalein are expected to change 0.00 10.00 20.00 30.00 40.00 50.00 60.00 70.00
color. Volume of titrant
mixed indicators, which are a mixture of two or more acid–base indicators, provide
a narrower range of pHs over which the color change occurs. A few examples of
such mixed indicators are included in the middle portion of Table 9.4. Adding a
neutral screening dye, such as methylene blue, also has been found to narrow the
pH range over which an indicator changes color (lower portion of Table 9.4). In
this case, the neutral dye provides a gray color at the midpoint of the indicator’s
color transition.
The relatively broad range of pHs over which any indicator changes color
places additional limitations on the feasibility of a titration. To minimize a determi-
nate titration error, an indicator’s entire color transition must lie within the sharp
transition in pH occurring near the equivalence point. Thus, in Figure 9.12 we see
that phenolphthalein is an appropriate indicator for the titration of 0.1 M acetic
acid with 0.1 M NaOH. Bromothymol blue, on the other hand, is an inappropriate
indicator since its change in color begins before the initial sharp rise in pH and, as a
result, spans a relatively large range of volumes. The early change in color increases
the probability of obtaining inaccurate results, and the range of possible end point
volumes increases the probability of obtaining imprecise results.
The need for the indicator’s color transition to occur in the sharply rising por-
tion of the titration curve justifies our earlier statement that not every equivalence
point has an end point. For example, trying to use a visual indicator to find the first
equivalence point in the titration of succinic acid (see Figure 9.10c) is pointless
since any difference between the equivalence point and the end point leads to a
large titration error.
Finding the End Point by Monitoring pH An alternative approach to finding a
titration’s end point is to monitor the titration reaction with a suitable sensor
whose signal changes as a function of the analyte’s concentration. Plotting the data
gives us the resulting titration curve. The end point may then be determined from
the titration curve with only a minimal error.
The most obvious sensor for an acid–base titration is a pH electrode.* For ex-
ample, Table 9.5 lists values for the pH and volume of titrant obtained during the
titration of a weak acid with NaOH. The resulting titration curve, which is called a
potentiometric titration curve, is shown in Figure 9.13a. The simplest method for
finding the end point is to visually locate the inflection point of the titration curve.
This is also the least accurate method, particularly if the titration curve’s slope at the
equivalence point is small.
*See Chapter 11 for more details about pH electrodes.