
Page 308 - Modern Analytical Chemistry
P. 308
1400-CH09 9/9/99 2:12 PM Page 291
Chapter 9 Titrimetric Methods of Analysis 291
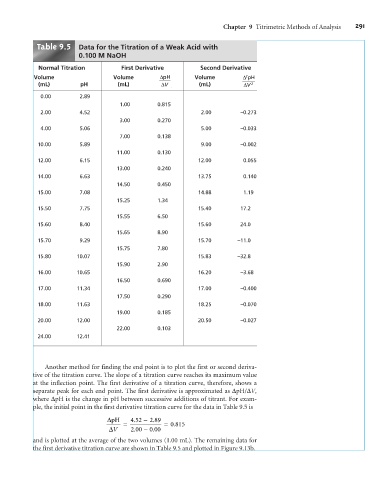
Table 9.5 Data for the Titration of a Weak Acid with
0.100 M NaOH
Normal Titration First Derivative Second Derivative
Volume Volume DpH Volume D pH
2
(mL) pH (mL) DV (mL) DV 2
0.00 2.89
1.00 0.815
2.00 4.52 2.00 –0.273
3.00 0.270
4.00 5.06 5.00 –0.033
7.00 0.138
10.00 5.89 9.00 –0.002
11.00 0.130
12.00 6.15 12.00 0.055
13.00 0.240
14.00 6.63 13.75 0.140
14.50 0.450
15.00 7.08 14.88 1.19
15.25 1.34
15.50 7.75 15.40 17.2
15.55 6.50
15.60 8.40 15.60 24.0
15.65 8.90
15.70 9.29 15.70 –11.0
15.75 7.80
15.80 10.07 15.83 –32.8
15.90 2.90
16.00 10.65 16.20 –3.68
16.50 0.690
17.00 11.34 17.00 –0.400
17.50 0.290
18.00 11.63 18.25 –0.070
19.00 0.185
20.00 12.00 20.50 –0.027
22.00 0.103
24.00 12.41
Another method for finding the end point is to plot the first or second deriva-
tive of the titration curve. The slope of a titration curve reaches its maximum value
at the inflection point. The first derivative of a titration curve, therefore, shows a
separate peak for each end point. The first derivative is approximated as DpH/DV,
where DpH is the change in pH between successive additions of titrant. For exam-
ple, the initial point in the first derivative titration curve for the data in Table 9.5 is
.
.
DpH 452 -2 89
= = 0 815
.
.
DV 200 -0 00
.
and is plotted at the average of the two volumes (1.00 mL). The remaining data for
the first derivative titration curve are shown in Table 9.5 and plotted in Figure 9.13b.