
Page 313 - Modern Analytical Chemistry
P. 313
1400-CH09 9/9/99 2:12 PM Page 296
296 Modern Analytical Chemistry
20.0 If the same titration is carried out in a nonaqueous solvent with a K s
–20
15.0 (b) of 1.0 ´10 , the pH when the titration is 90% complete is still 5.3.
However, the pH when the titration is 110% complete is now
pH 10.0 (a)
pH=pK s – pOH = 20.0 – 5.3 = 14.7
5.0
In this case the change in pH of
0.0
0.00 20.00 40.00 60.00 80.00 100.00 DpH = 14.7 – 5.3 = 9.4
Volume of titrant
is significantly greater than that obtained when the titration is carried
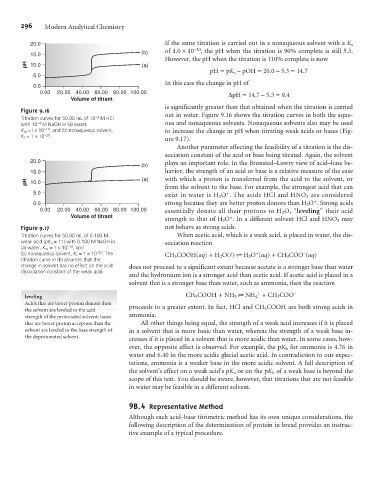
Figure 9.16
Titration curves for 50.00 mL of 10 –4 M HCl out in water. Figure 9.16 shows the titration curves in both the aque-
with 10 –4 M NaOH in (a) water, ous and nonaqueous solvents. Nonaqueous solvents also may be used
K w =l ´10 –14 , and (b) nonaqueous solvent, to increase the change in pH when titrating weak acids or bases (Fig-
K s =1 ´10 –20 .
ure 9.17).
Another parameter affecting the feasibility of a titration is the dis-
sociation constant of the acid or base being titrated. Again, the solvent
20.0 plays an important role. In the Brønsted–Lowry view of acid–base be-
(b)
15.0 havior, the strength of an acid or base is a relative measure of the ease
pH 10.0 (a) with which a proton is transferred from the acid to the solvent, or
from the solvent to the base. For example, the strongest acid that can
5.0 +
exist in water is H 3 O . The acids HCl and HNO 3 are considered
+
0.0 strong because they are better proton donors than H 3 O . Strong acids
0.00 20.00 40.00 60.00 80.00 100.00 essentially donate all their protons to H 2 O, “leveling” their acid
Volume of titrant +
strength to that of H 3 O . In a different solvent HCl and HNO 3 may
Figure 9.17 not behave as strong acids.
Titration curves for 50.00 mL of 0.100 M When acetic acid, which is a weak acid, is placed in water, the dis-
weak acid (pK a = 11) with 0.100 M NaOH in sociation reaction
(a) water, K w =1 ´10 –14 ; and
+
–
(b) nonaqueous solvent, K s =1 ´10 –20 . The CH 3 COOH(aq)+H 2 O(l) t H 3 O (aq)+CH 3 COO (aq)
titration curve in (b) assumes that the
change in solvent has no effect on the acid does not proceed to a significant extent because acetate is a stronger base than water
dissociation constant of the weak acid.
and the hydronium ion is a stronger acid than acetic acid. If acetic acid is placed in a
solvent that is a stronger base than water, such as ammonia, then the reaction
+
leveling CH 3 COOH + NH 3 t NH 4 +CH 3 COO –
Acids that are better proton donors than
the solvent are leveled to the acid proceeds to a greater extent. In fact, HCl and CH 3COOH are both strong acids in
strength of the protonated solvent; bases ammonia.
that are better proton acceptors than the All other things being equal, the strength of a weak acid increases if it is placed
solvent are leveled to the base strength of in a solvent that is more basic than water, whereas the strength of a weak base in-
the deprotonated solvent.
creases if it is placed in a solvent that is more acidic than water. In some cases, how-
ever, the opposite effect is observed. For example, the pK b for ammonia is 4.76 in
water and 6.40 in the more acidic glacial acetic acid. In contradiction to our expec-
tations, ammonia is a weaker base in the more acidic solvent. A full description of
the solvent’s effect on a weak acid’s pK a or on the pK b of a weak base is beyond the
scope of this text. You should be aware, however, that titrations that are not feasible
in water may be feasible in a different solvent.
9 4 Representative Method
B.
Although each acid–base titrimetric method has its own unique considerations, the
following description of the determination of protein in bread provides an instruc-
tive example of a typical procedure.