Page 311 - Modern Analytical Chemistry
P. 311

1400-CH09  9/9/99  2:12 PM  Page 294


              294    Modern Analytical Chemistry


                                                      9
                                               Table  .6    Gran Plot Treatment of the Data
                                                            in Table 9.5
                  Titration branch  Excess           Volume
               Temperature         branch              (mL)               V b ´[H 3 O ] ´10 7
                                   titration
                                                                                 +
                                                       2.00
                                                                             604
                                                       4.00
                                                      10.00                  348
                                                                             129
                                                      12.00                   85.0
                                                      14.00                   33.8
                         0
                           V titr                     15.00                   12.5
                                                      15.55                    2.76
              (a)                                     15.60                    0.621
                                                      15.70                    0.0805
                                                      15.80                    0.0135


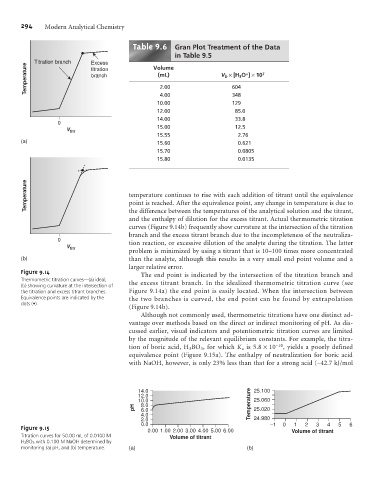
               Temperature                    temperature continues to rise with each addition of titrant until the equivalence


                                              point is reached. After the equivalence point, any change in temperature is due to
                                              the difference between the temperatures of the analytical solution and the titrant,
                                              and the enthalpy of dilution for the excess titrant. Actual thermometric titration
                                              curves (Figure 9.14b) frequently show curvature at the intersection of the titration
                                              branch and the excess titrant branch due to the incompleteness of the neutraliza-
                         0                    tion reaction, or excessive dilution of the analyte during the titration. The latter
                           V titr
                                              problem is minimized by using a titrant that is 10–100 times more concentrated
              (b)                             than the analyte, although this results in a very small end point volume and a
                                              larger relative error.
              Figure 9.14
                                                  The end point is indicated by the intersection of the titration branch and
              Thermometric titration curves—(a) ideal;
              (b) showing curvature at the intersection of  the excess titrant branch. In the idealized thermometric titration curve (see
              the titration and excess titrant branches.  Figure 9.14a) the end point is easily located. When the intersection between
              Equivalence points are indicated by the   the two branches is curved, the end point can be found by extrapolation
              dots (•).
                                              (Figure 9.14b).
                                                  Although not commonly used, thermometric titrations have one distinct ad-
                                              vantage over methods based on the direct or indirect monitoring of pH. As dis-
                                              cussed earlier, visual indicators and potentiometric titration curves are limited
                                              by the magnitude of the relevant equilibrium constants. For example, the titra-
                                              tion of boric acid, H 3 BO 3 , for which K a is 5.8 ´10 –10 , yields a poorly defined
                                              equivalence point (Figure 9.15a). The enthalpy of neutralization for boric acid
                                              with NaOH, however, is only 23% less than that for a strong acid (–42.7 kJ/mol


                                                 14.0                              25.100
                                                 12.0
                                                 10.0                              25.060
                                               pH  8.0                            Temperature  25.020
                                                  6.0
                                                  4.0
                                                  2.0                              24.980
                                                  0.0                                   –1  0  1   2  3   4  5  6
              Figure 9.15                           0.00 1.00  2.00 3.00 4.00 5.00  6.00       Volume of titrant
              Titration curves for 50.00 mL of 0.0100 M   Volume of titrant
              H 3 BO 3 with 0.100 M NaOH determined by
              monitoring (a) pH, and (b) temperature.  (a)                       (b)
   306   307   308   309   310   311   312   313   314   315   316