Page 306 - Modern Analytical Chemistry
P. 306

1400-CH09  9/9/99  2:12 PM  Page 289


                                                                          Chapter 9 Titrimetric Methods of Analysis  289

                                                                        –
                 whenever the concentration of HIn is ten times less than that of In . Substi-  pH
                 tuting these inequalities into equation 9.6                                            In –
                                                  1                                                pH = pK   + 1
                                          K
                                                            1
                                    pH =  p a +log   = p a K  -                                          a,HIn
                                                 10                                                  Indicator’s
                                                                                    pH = pK a,HIn   color transition
                                                  10                                                   region
                                    pH =  p a +log   = p a K  +                                    pH = pK   – 1
                                                            1
                                          K
                                                  1                                                      a,HIn
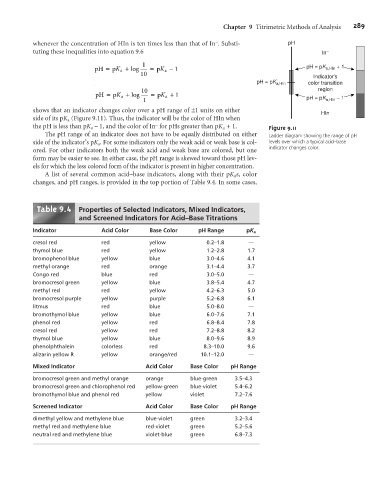
                 shows that an indicator changes color over a pH range of ±1 units on either
                                                                                                        HIn
                 side of its pK a (Figure 9.11). Thus, the indicator will be the color of HIn when
                                                      –
                 the pH is less than pK a – 1, and the color of In for pHs greater than pK a +1.  Figure 9.11
                     The pH range of an indicator does not have to be equally distributed on either  Ladder diagram showing the range of pH
                 side of the indicator’s pK a . For some indicators only the weak acid or weak base is col-  levels over which a typical acid–base
                                                                                        indicator changes color.
                 ored. For other indicators both the weak acid and weak base are colored, but one
                 form may be easier to see. In either case, the pH range is skewed toward those pH lev-
                 els for which the less colored form of the indicator is present in higher concentration.
                     A list of several common acid–base indicators, along with their pK a s, color
                 changes, and pH ranges, is provided in the top portion of Table 9.4. In some cases,

                         9 4
                  Table  .     Properties of Selected Indicators, Mixed Indicators,
                               and Screened Indicators for Acid–Base Titrations

                 Indicator            Acid Color    Base Color     pH Range      pK a
                 cresol red           red           yellow           0.2–1.8      —
                 thymol blue          red           yellow           1.2–2.8      1.7
                 bromophenol blue     yellow        blue             3.0–4.6      4.1
                 methyl orange        red           orange           3.1–4.4      3.7
                 Congo red            blue          red              3.0–5.0      —
                 bromocresol green    yellow        blue             3.8–5.4      4.7
                 methyl red           red           yellow           4.2–6.3      5.0
                 bromocresol purple   yellow        purple           5.2–6.8      6.1
                 litmus               red           blue             5.0–8.0      —
                 bromothymol blue     yellow        blue             6.0–7.6      7.1
                 phenol red           yellow        red              6.8–8.4      7.8
                 cresol red           yellow        red              7.2–8.8      8.2
                 thymol blue          yellow        blue             8.0–9.6      8.9
                 phenolphthalein      colorless     red             8.3–10.0      9.6
                 alizarin yellow R    yellow        orange/red      10.1–12.0     —
                 Mixed Indicator                   Acid Color   Base Color   pH Range

                 bromocresol green and methyl orange  orange    blue-green    3.5–4.3
                 bromocresol green and chlorophenol red  yellow-green  blue-violet  5.4–6.2
                 bromothymol blue and phenol red   yellow       violet        7.2–7.6
                 Screened Indicator                Acid Color   Base Color   pH Range
                 dimethyl yellow and methylene blue  blue-violet  green       3.2–3.4
                 methyl red and methylene blue     red-violet   green         5.2–5.6
                 neutral red and methylene blue    violet-blue  green         6.8–7.3
   301   302   303   304   305   306   307   308   309   310   311