Page 305 - Modern Analytical Chemistry
P. 305

1400-CH09  9/9/99  2:12 PM  Page 288


              288    Modern Analytical Chemistry


                                                                           –
                                                                                    –
                                                              H 2 A(aq)+OH (aq) ® HA (aq)+H 2 O(l)             9.3
                                                                  –
                                                                                   2–
                                                                           –
                                                               HA (aq)+OH (aq) ® A (aq)+H 2 O(l)               9.4
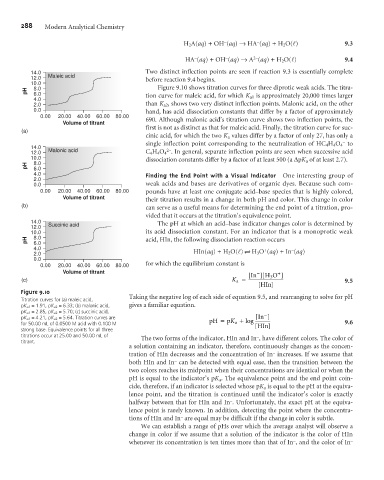
                 14.0                              Two distinct inflection points are seen if reaction 9.3 is essentially complete
                 12.0  Maleic acid                 before reaction 9.4 begins.
                 10.0
               pH  8.0                                 Figure 9.10 shows titration curves for three diprotic weak acids. The titra-
                 6.0
                 4.0                               tion curve for maleic acid, for which K a1 is approximately 20,000 times larger
                 2.0                               than K a2 , shows two very distinct inflection points. Malonic acid, on the other
                 0.0                               hand, has acid dissociation constants that differ by a factor of approximately
                   0.00  20.00  40.00  60.00  80.00  690. Although malonic acid’s titration curve shows two inflection points, the
                          Volume of titrant
                                                   first is not as distinct as that for maleic acid. Finally, the titration curve for suc-
              (a)
                                                   cinic acid, for which the two K a values differ by a factor of only 27, has only a
                                                                                                              –
                                                   single inflection point corresponding to the neutralization of HC 4 H 4 O 4 to
                 14.0                                    2–
                 12.0  Malonic acid                C 4 H 4 O 4 . In general, separate inflection points are seen when successive acid
                 10.0                              dissociation constants differ by a factor of at least 500 (a DpK a of at least 2.7).
               pH  8.0
                 6.0
                 4.0                               Finding the End Point with a Visual Indicator  One interesting group of
                 2.0
                 0.0                               weak acids and bases are derivatives of organic dyes. Because such com-
                   0.00  20.00  40.00  60.00  80.00  pounds have at least one conjugate acid–base species that is highly colored,
                          Volume of titrant        their titration results in a change in both pH and color. This change in color
              (b)                                  can serve as a useful means for determining the end point of a titration, pro-
                                                   vided that it occurs at the titration’s equivalence point.
                 14.0  Succinic acid                   The pH at which an acid–base indicator changes color is determined by
                 12.0
                 10.0                              its acid dissociation constant. For an indicator that is a monoprotic weak
               pH  8.0                             acid, HIn, the following dissociation reaction occurs
                 6.0
                 4.0                                                                   +       –
                 2.0                                             HIn(aq)+H 2 O(l) t H 3 O (aq)+In (aq)
                 0.0
                   0.00  20.00  40.00  60.00  80.00  for which the equilibrium constant is
                          Volume of titrant                                       [ In ][ H 3 O ]
                                                                                           +
                                                                                    -
              (c)                                                            K a =                             9.5
                                                                                     [ HIn]
              Figure 9.10
                                              Taking the negative log of each side of equation 9.5, and rearranging to solve for pH
              Titration curves for (a) maleic acid,
              pK a1 = 1.91, pK a2 = 6.33; (b) malonic acid,  gives a familiar equation.
              pK a1 = 2.85, pK a2 = 5.70; (c) succinic acid,                           -
              pK a1 = 4.21, pK a2 = 5.64. Titration curves are                      [ In ]
                                                                            K
              for 50.00 mL of 0.0500 M acid with 0.100 M              pH =  p a +log  [ HIn]                   9.6
              strong base. Equivalence points for all three
              titrations occur at 25.00 and 50.00 mL of  The two forms of the indicator, HIn and In , have different colors. The color of
                                                                                    –
              titrant.
                                              a solution containing an indicator, therefore, continuously changes as the concen-
                                                                                         –
                                              tration of HIn decreases and the concentration of In increases. If we assume that
                                                            –
                                              both HIn and In can be detected with equal ease, then the transition between the
                                              two colors reaches its midpoint when their concentrations are identical or when the
                                              pH is equal to the indicator’s pK a . The equivalence point and the end point coin-
                                              cide, therefore, if an indicator is selected whose pK a is equal to the pH at the equiva-
                                              lence point, and the titration is continued until the indicator’s color is exactly
                                                                            –
                                              halfway between that for HIn and In . Unfortunately, the exact pH at the equiva-
                                              lence point is rarely known. In addition, detecting the point where the concentra-
                                                              –
                                              tions of HIn and In are equal may be difficult if the change in color is subtle.
                                                  We can establish a range of pHs over which the average analyst will observe a
                                              change in color if we assume that a solution of the indicator is the color of HIn
                                                                                               –
                                              whenever its concentration is ten times more than that of In , and the color of In –
   300   301   302   303   304   305   306   307   308   309   310