
Page 309 - Modern Analytical Chemistry
P. 309
1400-CH09 9/9/99 2:12 PM Page 292
292 Modern Analytical Chemistry
14 10
12
8
10
pH 8 6 ∆pH/∆V 6 4
4
2
2
0 0
0 5 10 15 20 25 0 5 10 15 20 25
Volume of titrant (mL) Volume of titrant (mL)
(a) (b)
40 140
30
20 100
∆ 2 pH/∆V 2 –10 0 2 4 6 8 10 12 14 16 18 20 22 V b [H + ] ´ 10 7 120
10
80
60
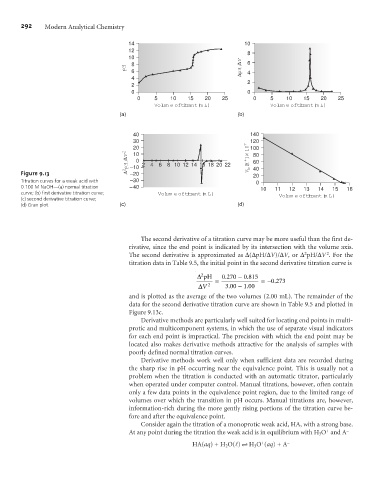
Figure 9.13 –20 40
20
Titration curves for a weak acid with –30 0
0.100 M NaOH—(a) normal titration –40 10 11 12 13 14 15 16
curve; (b) first derivative titration curve; Volume of titrant (mL) Volume of titrant (mL)
(c) second derivative titration curve;
(d) Gran plot. (c) (d)
The second derivative of a titration curve may be more useful than the first de-
rivative, since the end point is indicated by its intersection with the volume axis.
2
2
The second derivative is approximated as D(DpH/DV)/DV, or D pH/DV . For the
titration data in Table 9.5, the initial point in the second derivative titration curve is
2
.
D pH 0 270 - 0 815
.
= =- 0 273
.
.
.
DV 2 300 - 1 00
and is plotted as the average of the two volumes (2.00 mL). The remainder of the
data for the second derivative titration curve are shown in Table 9.5 and plotted in
Figure 9.13c.
Derivative methods are particularly well suited for locating end points in multi-
protic and multicomponent systems, in which the use of separate visual indicators
for each end point is impractical. The precision with which the end point may be
located also makes derivative methods attractive for the analysis of samples with
poorly defined normal titration curves.
Derivative methods work well only when sufficient data are recorded during
the sharp rise in pH occurring near the equivalence point. This is usually not a
problem when the titration is conducted with an automatic titrator, particularly
when operated under computer control. Manual titrations, however, often contain
only a few data points in the equivalence point region, due to the limited range of
volumes over which the transition in pH occurs. Manual titrations are, however,
information-rich during the more gently rising portions of the titration curve be-
fore and after the equivalence point.
Consider again the titration of a monoprotic weak acid, HA, with a strong base.
+
At any point during the titration the weak acid is in equilibrium with H 3O and A –
+
HA(aq)+H 2O(l) t H 3O (aq)+A –