
Page 356 - Modern Analytical Chemistry
P. 356
1400-CH09 9/9/99 2:13 PM Page 339
Chapter 9 Titrimetric Methods of Analysis 339
The most important class of redox indicators, however, are substances that
do not participate in the redox titration, but whose oxidized and reduced forms
differ in color. When added to a solution containing the analyte, the indicator im-
parts a color that depends on the solution’s electrochemical potential. Since the
indicator changes color in response to the electrochemical potential, and not to
the presence or absence of a specific species, these compounds are called general
redox indicators. redox indicator
The relationship between a redox indicator’s change in color and the solution’s A visual indicator used to signal the end
point in a redox titration.
electrochemical potential is easily derived by considering the half-reaction for the
indicator
–
In ox + ne t In red
where In ox and In red are, respectively, the indicator’s oxidized and reduced 1.800
forms. The Nernst equation for this reaction is 1.400
1.200
. 0 05916 [ In red ] Potential (V) 1.600 Ferroin
1.000
°
E = E In ox / - log 0.800 Diphenylamine
In red
n [In ox ] 0.600 sulfonic acid
0.400
If we assume that the indicator’s color in solution changes from that of In ox to 0.200
0.000
that of In red when the ratio [In red]/[In ox] changes from 0.1 to 10, then the end
0 20 40 60 80 100
point occurs when the solution’s electrochemical potential is within the range
Volume of titrant (mL)
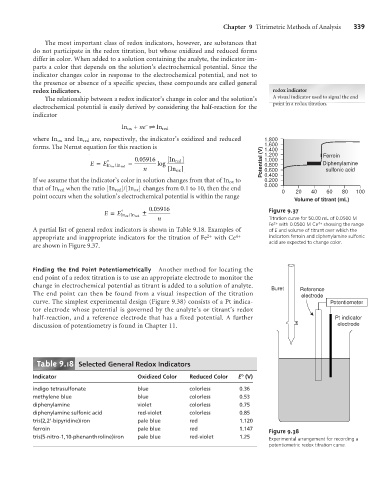
. 0 05916 Figure 9.37
°
E = E In ox / In red ±
n Titration curve for 50.00 mL of 0.0500 M
Fe 2+ with 0.0500 M Ce 4+ showing the range
A partial list of general redox indicators is shown in Table 9.18. Examples of of E and volume of titrant over which the
appropriate and inappropriate indicators for the titration of Fe 2+ with Ce 4+ indicators ferroin and diphenylamine sulfonic
acid are expected to change color.
are shown in Figure 9.37.
Finding the End Point Potentiometrically Another method for locating the
end point of a redox titration is to use an appropriate electrode to monitor the
change in electrochemical potential as titrant is added to a solution of analyte.
Buret Reference
The end point can then be found from a visual inspection of the titration electrode
curve. The simplest experimental design (Figure 9.38) consists of a Pt indica- Potentiometer
tor electrode whose potential is governed by the analyte’s or titrant’s redox
half-reaction, and a reference electrode that has a fixed potential. A further Pt indicator
discussion of potentiometry is found in Chapter 11. electrode
9
Table .18 Selected General Redox Indicators
Indicator Oxidized Color Reduced Color E° (V)
indigo tetrasulfonate blue colorless 0.36
methylene blue blue colorless 0.53
diphenylamine violet colorless 0.75
diphenylamine sulfonic acid red-violet colorless 0.85
tris(2,2’-bipyridine)iron pale blue red 1.120
ferroin pale blue red 1.147
Figure 9.38
tris(5-nitro-1,10-phenanthroline)iron pale blue red-violet 1.25
Experimental arrangement for recording a
potentiometric redox titration curve.