Page 378 - Modern Analytical Chemistry
P. 378

1400-CH09  9/9/99  2:14 PM  Page 361


                                                                          Chapter 9 Titrimetric Methods of Analysis  361

                    Volume NaOH               Volume NaOH                   2.18        8.009        6.71        9.374
                        (mL)          pH          (mL)         pH           2.38        8.077        6.92        9.414
                                                                            2.60        8.146        7.15        9.451
                         0.25         3.0        49.97         8.0
                                                                            2.79        8.208        7.36        9.484
                         0.86         3.2        49.98         8.2
                                                                            3.01        8.273        7.56        9.514
                         1.63         3.4        49.99         8.4
                                                                            3.19        8.332        7.79        9.545
                         2.72         3.6        50.00         8.7
                                                                            3.41        8.398        7.99        9.572
                         4.29         3.8        50.01         9.1
                                                                            3.60        8.458        8.21        9.599
                         6.54         4.0        50.02         9.4
                                                                            3.80        8.521        8.44        9.624
                         9.67         4.2        50.04         9.6
                                                                            3.99        8.584        8.64        9.645
                        13.79         4.4        50.06         9.8
                                                                            4.18        8.650        8.84        9.666
                        18.83         4.6        50.10        10.0
                                                                            4.40        8.720        9.07        9.688
                        24.47         4.8        50.16        10.2
                                                                            4.57        8.784        9.27        9.706
                        30.15         5.0        50.25        10.4
                        35.33         5.2        50.40        10.6   8. Calculate or sketch (or both) the titration curves for 50.0 mL
                        39.62         5.4        50.63        10.8      of a 0.100 M solution of a monoprotic weak acid (pK a =8)
                        42.91         5.6        51.01        11.0      with 0.1 M strong base in (a) water; and (b) a non-aqueous
                        45.28         5.8        51.61        11.2      solvent with K s =10 –20 . You may assume that the change in
                        46.91         6.0        52.58        11.4      solvent does not affect the weak acid’s pK a .
                        48.01         6.2        54.15        11.6   9. The titration of a mixture of p-nitrophenol (pK a = 7.0) and
                        48.72         6.4        56.73        11.8      m-nitrophenol (pK a = 8.3) can be followed
                        49.19         6.6        61.11        12.0      spectrophotometrically. Neither acid absorbs at a wavelength
                                                                        of 545 nm, but their respective conjugate bases do absorb at
                        49.48         6.8        68.83        12.2
                                                                        this wavelength. The m-nitrophenolate ion has a greater
                        49.67         7.0        83.54        12.4
                                                                        absorbance than an equimolar solution of the
                        49.79         7.2       116.14        12.6
                                                                        p-nitrophenolate ion. Sketch the spectrophotometric titration
                        49.87         7.4
                                                                        curve for a 50.00-mL mixture consisting of 0.0500 M
                        49.92         7.6                               p-nitrophenol and 0.0500 M m-nitrophenol with 0.100 M
                        49.95         7.8                               NaOH, and compare the curve with the expected
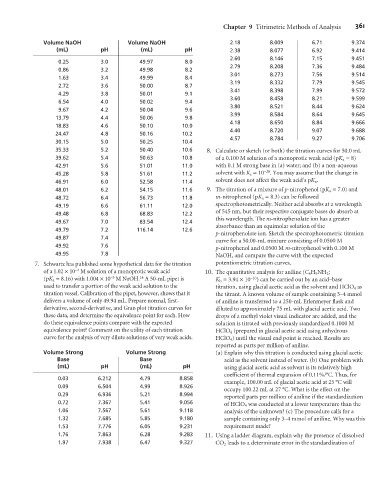
                  7. Schwartz has published some hypothetical data for the titration  potentiometric titration curves.
                              –4
                    of a 1.02 ´10 M solution of a monoprotic weak acid  10. The quantitative analysis for aniline (C 6 H 5 NH 2 ;
                                                 14
                                        –3
                    (pK a = 8.16) with 1.004 ´10 M NaOH. A 50-mL pipet is  K b = 3.94 ´10 –10 ) can be carried out by an acid–base
                    used to transfer a portion of the weak acid solution to the  titration, using glacial acetic acid as the solvent and HClO 4 as
                    titration vessel. Calibration of the pipet, however, shows that it  the titrant. A known volume of sample containing 3–4 mmol
                    delivers a volume of only 49.94 mL. Prepare normal, first-  of aniline is transferred to a 250-mL Erlenmeyer flask and
                    derivative, second-derivative, and Gran plot titration curves for  diluted to approximately 75 mL with glacial acetic acid. Two
                    these data, and determine the equivalence point for each. How  drops of a methyl violet visual indicator are added, and the
                    do these equivalence points compare with the expected  solution is titrated with previously standardized 0.1000 M
                    equivalence point? Comment on the utility of each titration  HClO 4 (prepared in glacial acetic acid using anhydrous
                    curve for the analysis of very dilute solutions of very weak acids.  HClO 4) until the visual end point is reached. Results are
                                                                        reported as parts per million of aniline.
                    Volume Strong            Volume Strong              (a) Explain why this titration is conducted using glacial acetic
                        Base                     Base                      acid as the solvent instead of water. (b) One problem with
                         (mL)         pH         (mL)         pH           using glacial acetic acid as solvent is its relatively high
                                                                           coefficient of thermal expansion of 0.11%/°C. Thus, for
                         0.03        6.212       4.79        8.858
                                                                           example, 100.00 mL of glacial acetic acid at 25 °C will
                         0.09        6.504       4.99        8.926
                                                                           occupy 100.22 mL at 27 °C. What is the effect on the
                         0.29        6.936       5.21        8.994         reported parts per million of aniline if the standardization
                         0.72        7.367       5.41        9.056         of HClO 4 was conducted at a lower temperature than the
                         1.06        7.567       5.61        9.118         analysis of the unknown? (c) The procedure calls for a
                         1.32        7.685       5.85        9.180         sample containing only 3–4 mmol of aniline. Why was this
                         1.53        7.776       6.05        9.231         requirement made?
                         1.76        7.863       6.28        9.283   11. Using a ladder diagram, explain why the presence of dissolved
                         1.97        7.938       6.47        9.327      CO 2 leads to a determinate error in the standardization of
   373   374   375   376   377   378   379   380   381   382   383