Page 374 - Modern Analytical Chemistry
P. 374
1400-CH09  9/9/99  2:14 PM  Page 357


                                                                          Chapter 9 Titrimetric Methods of Analysis  357

                                         –
                     Solving for the grams of I , we find
                         –
                                  –
                       g I = (AW I )(M Ag V Ag – M SCN V SCN )
                           = (126.9 g/mol)[(0.05619 M)(0.05000 L) – (0.05322 M)(0.03514 L)]

                           = 0.1192 g
                                                                                      16.00
                     that there is 0.1192 g of iodide. The weight percent iodide, therefore, is  14.00
                                                                                      12.00
                                       0 1192 g
                                        .
                                               ´ 100 = 17 76.% w/w I -                pAg 10.00
                                                                                       8.00
                                         0.6712 g                                      6.00
                                                                                       4.00
                                                                                       2.00
                                                                                       0.00
                                                                                            0   20   40  60   80  100
                 9E.4  Evaluation of Precipitation Titrimetry                                   Volume AgNO  (mL)
                                                                                                           3
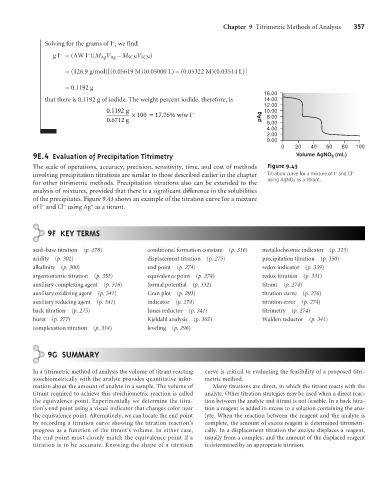
                 The scale of operations, accuracy, precision, sensitivity, time, and cost of methods  Figure 9.43
                                                                                                            –
                 involving precipitation titrations are similar to those described earlier in the chapter  Titration curve for a mixture of I and Cl –
                                                                                        using AgNO 3 as a titrant.
                 for other titrimetric methods. Precipitation titrations also can be extended to the
                 analysis of mixtures, provided that there is a significant difference in the solubilities
                 of the precipitates. Figure 9.43 shows an example of the titration curve for a mixture
                                   +
                          –
                    –
                 of I and Cl using Ag as a titrant.
                      9 F KEY TERMS

                 acid–base titration  (p. 278)      conditional formation constant  (p. 316)  metallochromic indicator  (p. 323)
                 acidity  (p. 301)                  displacement titration  (p. 275)  precipitation titration  (p. 350)
                 alkalinity  (p. 300)               end point  (p. 274)               redox indicator  (p. 339)
                 argentometric titration  (p. 355)  equivalence point  (p. 274)       redox titration  (p. 331)
                 auxiliary complexing agent  (p. 316)  formal potential  (p. 332)     titrant  (p. 274)
                 auxiliary oxidizing agent  (p. 341)  Gran plot  (p. 293)             titration curve  (p. 276)
                 auxiliary reducing agent  (p. 341)  indicator  (p. 274)              titration error  (p. 274)
                 back titration  (p. 275)           Jones reductor  (p. 341)          titrimetry  (p. 274)
                 buret  (p. 277)                    Kjeldahl analysis  (p. 302)       Walden reductor  (p. 341)
                 complexation titration  (p. 314)   leveling  (p. 296)


                      9 G SUMMARY

                 In a titrimetric method of analysis the volume of titrant reacting  curve is critical to evaluating the feasibility of a proposed titri-
                 stoichiometrically with the analyte provides quantitative infor-  metric method.
                 mation about the amount of analyte in a sample. The volume of  Many titrations are direct, in which the titrant reacts with the
                 titrant required to achieve this stoichiometric reaction is called  analyte. Other titration strategies may be used when a direct reac-
                 the equivalence point. Experimentally we determine the titra-  tion between the analyte and titrant is not feasible. In a back titra-
                 tion’s end point using a visual indicator that changes color near  tion a reagent is added in excess to a solution containing the ana-
                 the equivalence point. Alternatively, we can locate the end point  lyte. When the reaction between the reagent and the analyte is
                 by recording a titration curve showing the titration reaction’s  complete, the amount of excess reagent is determined titrimetri-
                 progress as a function of the titrant’s volume. In either case,   cally. In a displacement titration the analyte displaces a reagent,
                 the end point must closely match the equivalence point if a  usually from a complex, and the amount of the displaced reagent
                 titration is to be accurate. Knowing the shape of a titration  is determined by an appropriate titration.

