
Page 71 - Modern Analytical Chemistry
P. 71
1400-CH04 9/8/99 3:53 PM Page 54
54 Modern Analytical Chemistry
4 A Characterizing Measurements and Results
Let’s begin by choosing a simple quantitative problem requiring a single measure-
ment. The question to be answered is—What is the mass of a penny? If you think
about how we might answer this question experimentally, you will realize that this
problem is too broad. Are we interested in the mass of United State pennies or Cana-
dian pennies, or is the difference in country of importance? Since the composition of
a penny probably differs from country to country, let’s limit our problem to pennies
minted in the United States. There are other considerations. Pennies are minted at
several locations in the United States (this is the meaning of the letter, or absence of a
letter, below the date stamped on the lower right corner of the face of the coin).
Since there is no reason to expect a difference between where the penny was minted,
we will choose to ignore this consideration. Is there a reason to expect a difference
between a newly minted penny not yet in circulation, and a penny that has been in
circulation? The answer to this is not obvious. Let’s simplify the problem by narrow-
ing the question to—What is the mass of an average United States penny in circula-
tion? This is a problem that we might expect to be able to answer experimentally.
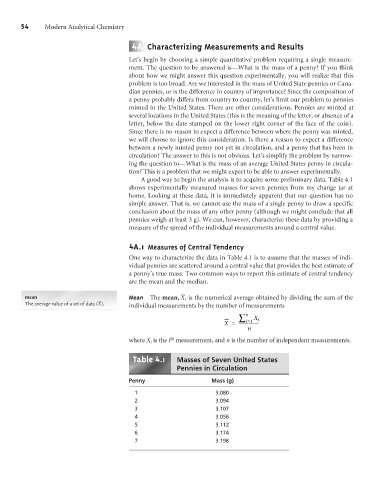
A good way to begin the analysis is to acquire some preliminary data. Table 4.1
shows experimentally measured masses for seven pennies from my change jar at
home. Looking at these data, it is immediately apparent that our question has no
simple answer. That is, we cannot use the mass of a single penny to draw a specific
conclusion about the mass of any other penny (although we might conclude that all
pennies weigh at least 3 g). We can, however, characterize these data by providing a
measure of the spread of the individual measurements around a central value.
4 A.1 Measures of Central Tendency
One way to characterize the data in Table 4.1 is to assume that the masses of indi-
vidual pennies are scattered around a central value that provides the best estimate of
a penny’s true mass. Two common ways to report this estimate of central tendency
are the mean and the median.
–
mean – Mean The mean, X, is the numerical average obtained by dividing the sum of the
The average value of a set of data (X). individual measurements by the number of measurements
n
å X i
X = i=1
n
th
where X i is the i measurement, and n is the number of independent measurements.
4
Table .1 Masses of Seven United States
Pennies in Circulation
Penny Mass (g)
1 3.080
2 3.094
3 3.107
4 3.056
5 3.112
6 3.174
7 3.198