
Page 183 - Modern Optical Engineering The Design of Optical Systems
P. 183
166 Chapter Eight
sensitive to yellow-green light at a wavelength of 0.55 m, and its
sensitivity drops off on either side of this peak. For most purposes the
sensitivity of the eye may be considered to extend from 0.4 to 0.7 m.
(or 0.38 to 0.78) Thus, in designing an optical instrument for visual
use, the monochromatic aberrations are corrected for a wavelength of
0.55 or 0.59 m and chromatic aberration is corrected by bringing the
red and blue wavelengths to a common focus. The wavelengths usually
chosen are either e(0.5461 m) or d(0.5876 m) for the yellow,
C(0.6563 m) for the red, and F(0.4861 m) for the blue.
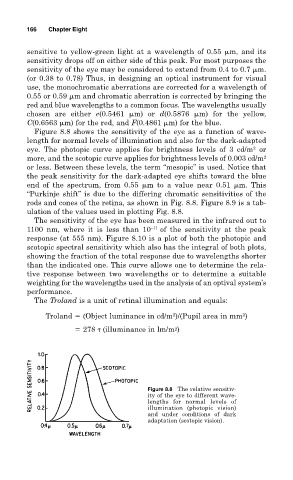
Figure 8.8 shows the sensitivity of the eye as a function of wave-
length for normal levels of illumination and also for the dark-adapted
2
eye. The photopic curve applies for brightness levels of 3 cd/m or
more, and the scotopic curve applies for brightness levels of 0.003 cd/m 2
or less. Between these levels, the term “mesopic” is used. Notice that
the peak sensitivity for the dark-adapted eye shifts toward the blue
end of the spectrum, from 0.55 m to a value near 0.51 m. This
“Purkinje shift” is due to the differing chromatic sensitivities of the
rods and cones of the retina, as shown in Fig. 8.8. Figure 8.9 is a tab-
ulation of the values used in plotting Fig. 8.8.
The sensitivity of the eye has been measured in the infrared out to
1100 nm, where it is less than 10 –11 of the sensitivity at the peak
response (at 555 nm). Figure 8.10 is a plot of both the photopic and
scotopic spectral sensitivity which also has the integral of both plots,
showing the fraction of the total response due to wavelengths shorter
than the indicated one. This curve allows one to determine the rela-
tive response between two wavelengths or to determine a suitable
weighting for the wavelengths used in the analysis of an optival system’s
performance.
The Troland is a unit of retinal illumination and equals:
2
2
Troland (Object luminance in cd/m )/(Pupil area in mm )
278 (illuminance in lm/m 2 )
Figure 8.8 The relative sensitiv-
ity of the eye to different wave-
lengths for normal levels of
illumination (photopic vision)
and under conditions of dark
adaptation (scotopic vision).