
Page 181 - Modern Optical Engineering The Design of Optical Systems
P. 181
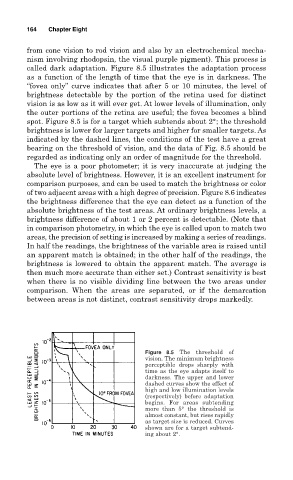
164   Chapter Eight

        from cone vision to rod vision and also by an electrochemical mecha-
        nism involving rhodopsin, the visual purple pigment). This process is
        called dark adaptation. Figure 8.5 illustrates the adaptation process
        as a function of the length of time that the eye is in darkness. The
        “fovea only” curve indicates that after 5 or 10 minutes, the level of
        brightness detectable by the portion of the retina used for distinct
        vision is as low as it will ever get. At lower levels of illumination, only
        the outer portions of the retina are useful; the fovea becomes a blind
        spot. Figure 8.5 is for a target which subtends about 2°; the threshold
        brightness is lower for larger targets and higher for smaller targets. As
        indicated by the dashed lines, the conditions of the test have a great
        bearing on the threshold of vision, and the data of Fig. 8.5 should be
        regarded as indicating only an order of magnitude for the threshold.
          The eye is a poor photometer; it is very inaccurate at judging the
        absolute level of brightness. However, it is an excellent instrument for
        comparison purposes, and can be used to match the brightness or color
        of two adjacent areas with a high degree of precision. Figure 8.6 indicates
        the brightness difference that the eye can detect as a function of the
        absolute brightness of the test areas. At ordinary brightness levels, a
        brightness difference of about 1 or 2 percent is detectable. (Note that
        in comparison photometry, in which the eye is called upon to match two
        areas, the precision of setting is increased by making a series of readings.
        In half the readings, the brightness of the variable area is raised until
        an apparent match is obtained; in the other half of the readings, the
        brightness is lowered to obtain the apparent match. The average is
        then much more accurate than either set.) Contrast sensitivity is best
        when there is no visible dividing line between the two areas under
        comparison. When the areas are separated, or if the demarcation
        between areas is not distinct, contrast sensitivity drops markedly.


                                        Figure 8.5 The threshold of
                                        vision. The minimum brightness
                                        perceptible drops sharply with
                                        time as the eye adapts itself to
                                        darkness. The upper and lower
                                        dashed curves show the effect of
                                        high and low illumination levels
                                        (respectively) before adaptation
                                        begins. For areas subtending
                                        more than 5° the threshold is
                                        almost constant, but rises rapidly
                                        as target size is reduced. Curves
                                        shown are for a target subtend-
                                        ing about 2°.