
Page 224 - Modern Optical Engineering The Design of Optical Systems
P. 224
Optical Materials 207
in series will be 0.45 0.45 20 percent unless they have a uniform
spectral transmission (neutral density). To take an extreme example,
if the filter transmits nothing from 1 to 1.5 m and 90 percent from 1.5
to 2 m, its “average” transmission will be 45 percent within the 1- to
2- m band. However, two such filters, when combined, will transmit
zero from 1 to 1.5 m, and about 81 percent from 1.5 to 2 m, for an
“average” transmission of about 40 percent, rather than the 20 percent
which two neutral density filters would transmit.
The photographic density of a filter is the log of its opacity (the
reciprocal of transmittance), thus
1
D log log T
T
where D is the density and T is the transmittance of the material. Note
that transmittance does not account for surface reflection losses; thus,
density is directly proportional to thickness. To a fair approximation,
the density of a “stack” of neutral density absorption filters is the sum
of the individual densities.
Equation 10.3 can be written to the base 10 if desired. This is done
when the term “density” is used to describe the transmission of, for
example, a photographic filter. The equation becomes
T 10 density
so that a density of 1.0 means a transmission of 10 percent, a density
of 2.0 means a transmission of 1 percent, etc. Note that densities can
be added. A neutral absorbing filter with a density of 1.0 combined
with a filter of density 2.0 will yield a density of 3.0 and a transmission
3
of 0.1 0.01 0.001 10 .
Index dispersion
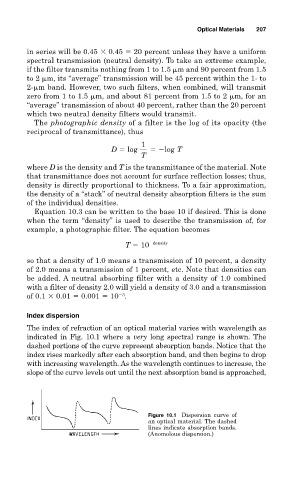
The index of refraction of an optical material varies with wavelength as
indicated in Fig. 10.1 where a very long spectral range is shown. The
dashed portions of the curve represent absorption bands. Notice that the
index rises markedly after each absorption band, and then begins to drop
with increasing wavelength. As the wavelength continues to increase, the
slope of the curve levels out until the next absorption band is approached,
Figure 10.1 Dispersion curve of
an optical material. The dashed
lines indicate absorption bands.
(Anomolous dispersion.)