
Page 185 - Multidimensional Chromatography
P. 185
178 Multidimensional Chromatography
n
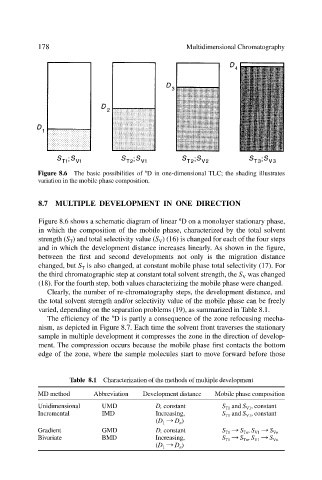
Figure 8.6 The basic possibilities of D in one-dimensional TLC; the shading illustrates
variation in the mobile phase composition.
8.7 MULTIPLE DEVELOPMENT IN ONE DIRECTION
n
Figure 8.6 shows a schematic diagram of linear D on a monolayer stationary phase,
in which the composition of the mobile phase, characterized by the total solvent
strength (S T ) and total selectivity value (S V ) (16) is changed for each of the four steps
and in which the development distance increases linearly. As shown in the figure,
between the first and second developments not only is the migration distance
changed, but S T is also changed, at constant mobile phase total selectivity (17). For
the third chromatographic step at constant total solvent strength, the S V was changed
(18). For the fourth step, both values characterizing the mobile phase were changed.
Clearly, the number of re-chromatography steps, the development distance, and
the total solvent strength and/or selectivity value of the mobile phase can be freely
varied, depending on the separation problems (19), as summarized in Table 8.1.
n
The efficiency of the D is partly a consequence of the zone refocusing mecha-
nism, as depicted in Figure 8.7. Each time the solvent front traverses the stationary
sample in multiple development it compresses the zone in the direction of develop-
ment. The compression occurs because the mobile phase first contacts the bottom
edge of the zone, where the sample molecules start to move forward before those
Table 8.1 Characterization of the methods of multiple development
MD method Abbreviation Development distance Mobile phase composition
Unidimensional UMD D, constant S T1 and S V1 , constant
Incremental IMD Increasing, S T1 and S V1 , constant
(D 1 : D n )
Gradient GMD D, constant S T1 : S Tn , S V1 : S Vn
Bivariate BMD Increasing, S T1 : S Tn , S V1 : S Vn
(D 1 : D n )