
Page 292 - Multidimensional Chromatography
P. 292
Biomedical and Pharmaceutical Applications 287
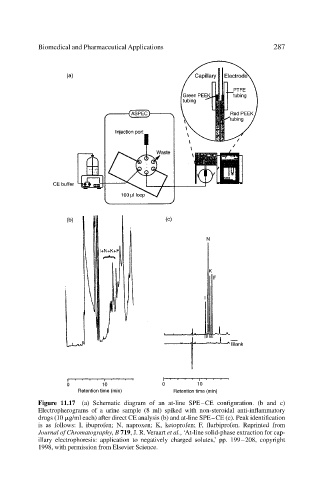
Figure 11.17 (a) Schematic diagram of an at-line SPE–CE configuration. (b and c)
Electropherograms of a urine sample (8 ml) spiked with non-steroidal anti-inflammatory
drugs (10 g/ml each) after direct CE analysis (b) and at-line SPE–CE (c). Peak identification
is as follows: I, ibuprofen; N, naproxen; K, ketoprofen; F, flurbiprofen. Reprinted from
Journal of Chromatography, B 719, J. R. Veraart et al., ‘At-line solid-phase extraction for cap-
illary electrophoresis: application to negatively charged solutes,’ pp. 199–208, copyright
1998, with permission from Elsevier Science.