
Page 41 - New Trends In Coal Conversion
P. 41
Coal 9
1.26% 0.78%
19.92%
1.3% 1.2% 71.6%
Anthracite and 36.23%
Bituminous Coal
22.8%
13.45%
Total Coal: 46.5%
1139331
milliontonnes
0.01% 0.45%
28.3%
2.85%
10.24%
28.4%
Sub-bituminous
Asia Pacific and Lignite
Europe and Eurasia
North America 14.82%
Middle East and Africa
South and Central America
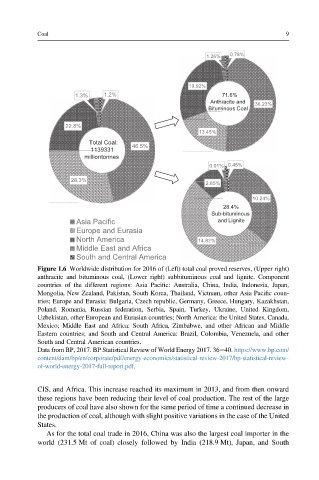
Figure 1.6 Worldwide distribution for 2016 of (Left) total coal proved reserves, (Upper right)
anthracite and bituminous coal, (Lower right) subbituminous coal and lignite. Component
countries of the different regions: Asia Pacific: Australia, China, India, Indonesia, Japan,
Mongolia, New Zealand, Pakistan, South Korea, Thailand, Vietnam, other Asia Pacific coun-
tries; Europe and Eurasia: Bulgaria, Czech republic, Germany, Greece, Hungary, Kazakhstan,
Poland, Romania, Russian federation, Serbia, Spain, Turkey, Ukraine, United Kingdom,
Uzbekistan, other European and Eurasian countries; North America: the United States, Canada,
Mexico; Middle East and Africa: South Africa, Zimbabwe, and other African and Middle
Eastern countries; and South and Central America: Brazil, Colombia, Venezuela, and other
South and Central American countries.
Data from BP, 2017. BP Statistical Review of World Energy 2017. 36e40. https://www.bp.com/
content/dam/bp/en/corporate/pdf/energy-economics/statistical-review-2017/bp-statistical-review-
of-world-energy-2017-full-report.pdf.
CIS, and Africa. This increase reached its maximum in 2013, and from then onward
these regions have been reducing their level of coal production. The rest of the large
producers of coal have also shown for the same period of time a continued decrease in
the production of coal, although with slight positive variations in the case of the United
States.
As for the total coal trade in 2016, China was also the largest coal importer in the
world (231.5 Mt of coal) closely followed by India (218.9 Mt), Japan, and South