
Page 522 - New Trends in Eco efficient and Recycled Concrete
P. 522
470 New Trends in Eco-efficient and Recycled Concrete
Figure 15.15 Stress distribution in the glazed ceramic aggregate/cement matrix ITZ
(numerical model). ITZ, Interfacial transition zone.
1.4E+08
Gravel
1.3E+08 Unglazed ceramic aggregate
Glazed ceramic aggregate
1.2E+08
Pressure (N/mm 2 ) 1.1E+08
1.0E+08
9.0E+07
8.0E+07
7.0E+07
Aggregate ITZ Cementitious matrix
6.0E+07
0.00624 0.00625 0.00626 0.00627 0.00628 0.00629 0.0063
Arc length (m)
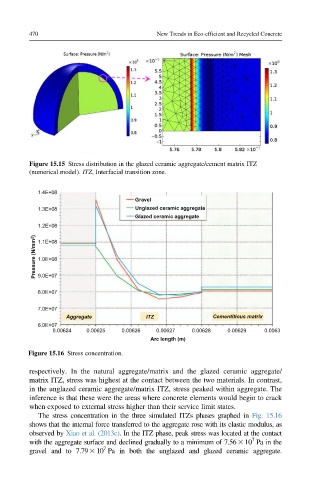
Figure 15.16 Stress concentration.
respectively. In the natural aggregate/matrix and the glazed ceramic aggregate/
matrix ITZ, stress was highest at the contact between the two materials. In contrast,
in the unglazed ceramic aggregate/matrix ITZ, stress peaked within aggregate. The
inference is that these were the areas where concrete elements would begin to crack
when exposed to external stress higher than their service limit states.
The stress concentration in the three simulated ITZs phases graphed in Fig. 15.16
shows that the internal force transferred to the aggregate rose with its elastic modulus, as
observed by Xiao et al. (2013c). In the ITZ phase, peak stress was located at the contact
7
with the aggregate surface and declined gradually to a minimum of 7.563 10 Pa in the
7
gravel and to 7.793 10 Pa in both the unglazed and glazed ceramic aggregate.