
Page 198 - Numerical Analysis and Modelling in Geomechanics
P. 198
BACK ANALYSIS OF GEOTECHNICAL PROBLEMS 179
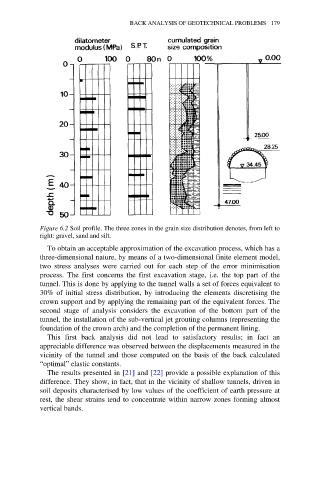
Figure 6.2 Soil profile. The three zones in the grain size distribution denotes, from left to
right: gravel, sand and silt.
To obtain an acceptable approximation of the excavation process, which has a
three-dimensional nature, by means of a two-dimensional finite element model,
two stress analyses were carried out for each step of the error minimisation
process. The first concerns the first excavation stage, i.e. the top part of the
tunnel. This is done by applying to the tunnel walls a set of forces equivalent to
30% of initial stress distribution, by introducing the elements discretising the
crown support and by applying the remaining part of the equivalent forces. The
second stage of analysis considers the excavation of the bottom part of the
tunnel, the installation of the sub-vertical jet grouting columns (representing the
foundation of the crown arch) and the completion of the permanent lining.
This first back analysis did not lead to satisfactory results; in fact an
appreciable difference was observed between the displacements measured in the
vicinity of the tunnel and those computed on the basis of the back calculated
“optimal” elastic constants.
The results presented in [21] and [22] provide a possible explanation of this
difference. They show, in fact, that in the vicinity of shallow tunnels, driven in
soil deposits characterised by low values of the coefficient of earth pressure at
rest, the shear strains tend to concentrate within narrow zones forming almost
vertical bands.