
Page 199 - Numerical Analysis and Modelling in Geomechanics
P. 199
180 ANNAMARIA CIVIDINI AND GIANCARLO GIODA
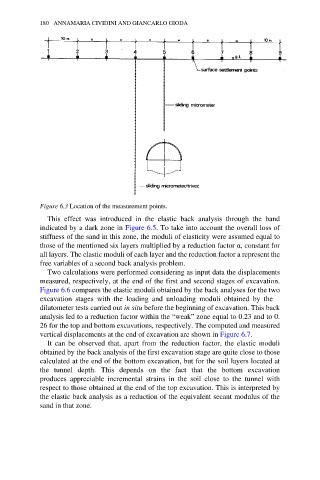
Figure 6.3 Location of the measurement points.
This effect was introduced in the elastic back analysis through the band
indicated by a dark zone in Figure 6.5. To take into account the overall loss of
stiffness of the sand in this zone, the moduli of elasticity were assumed equal to
those of the mentioned six layers multiplied by a reduction factor α, constant for
all layers. The elastic moduli of each layer and the reduction factor a represent the
free variables of a second back analysis problem.
Two calculations were performed considering as input data the displacements
measured, respectively, at the end of the first and second stages of excavation.
Figure 6.6 compares the elastic moduli obtained by the back analyses for the two
excavation stages with the loading and unloading moduli obtained by the
dilatometer tests carried out in situ before the beginning of excavation. This back
analysis led to a reduction factor within the “weak” zone equal to 0.23 and to 0.
26 for the top and bottom excavations, respectively. The computed and measured
vertical displacements at the end of excavation are shown in Figure 6.7.
It can be observed that, apart from the reduction factor, the elastic moduli
obtained by the back analysis of the first excavation stage are quite close to those
calculated at the end of the bottom excavation, but for the soil layers located at
the tunnel depth. This depends on the fact that the bottom excavation
produces appreciable incremental strains in the soil close to the tunnel with
respect to those obtained at the end of the top excavation. This is interpreted by
the elastic back analysis as a reduction of the equivalent secant modulus of the
sand in that zone.