
Page 204 - Numerical Analysis and Modelling in Geomechanics
P. 204
BACK ANALYSIS OF GEOTECHNICAL PROBLEMS 185
Figure 6.8 Schematic representation of the relationship between average shear stress τ and
displacement δ for direct shear tests on a stiff soil sample, and relevant failure envelopes.
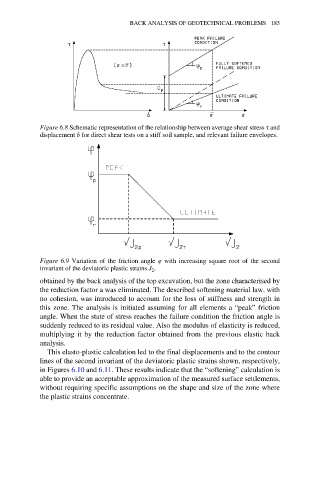
Figure 6.9 Variation of the friction angle φ with increasing square root of the second
invariant of the deviatoric plastic strains J 2 .
obtained by the back analysis of the top excavation, but the zone characterised by
the reduction factor a was eliminated. The described softening material law, with
no cohesion, was introduced to account for the loss of stiffness and strength in
this zone. The analysis is initiated assuming for all elements a “peak” friction
angle. When the state of stress reaches the failure condition the friction angle is
suddenly reduced to its residual value. Also the modulus of elasticity is reduced,
multiplying it by the reduction factor obtained from the previous elastic back
analysis.
This elasto-plastic calculation led to the final displacements and to the contour
lines of the second invariant of the deviatoric plastic strains shown, respectively,
in Figures 6.10 and 6.11. These results indicate that the “softening” calculation is
able to provide an acceptable approximation of the measured surface settlements,
without requiring specific assumptions on the shape and size of the zone where
the plastic strains concentrate.