
Page 265 - Numerical Analysis and Modelling in Geomechanics
P. 265
246 SEISMIC MICROZONING USING NUMERICAL MODELLING
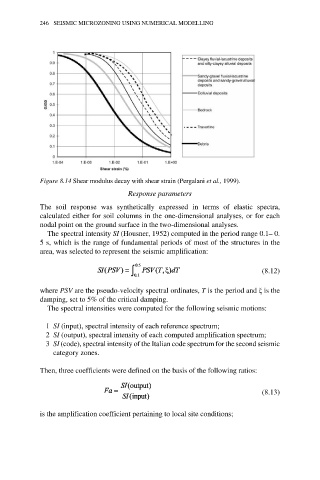
Figure 8.14 Shear modulus decay with shear strain (Pergalani et al., 1999).
Response parameters
The soil response was synthetically expressed in terms of elastic spectra,
calculated either for soil columns in the one-dimensional analyses, or for each
nodal point on the ground surface in the two-dimensional analyses.
The spectral intensity SI (Housner, 1952) computed in the period range 0.1– 0.
5 s, which is the range of fundamental periods of most of the structures in the
area, was selected to represent the seismic amplification:
(8.12)
where PSV are the pseudo-velocity spectral ordinates, T is the period and ξ is the
damping, set to 5% of the critical damping.
The spectral intensities were computed for the following seismic motions:
1 SI (input), spectral intensity of each reference spectrum;
2 SI (output), spectral intensity of each computed amplification spectrum;
3 SI (code), spectral intensity of the Italian code spectrum for the second seismic
category zones.
Then, three coefficients were defined on the basis of the following ratios:
(8.13)
is the amplification coefficient pertaining to local site conditions;