
Page 245 - Optical Communications Essentials
P. 245
Performance Measures
Performance Measures 235
10 0
10 −3
10 −6
P e
10 −9 _ 9
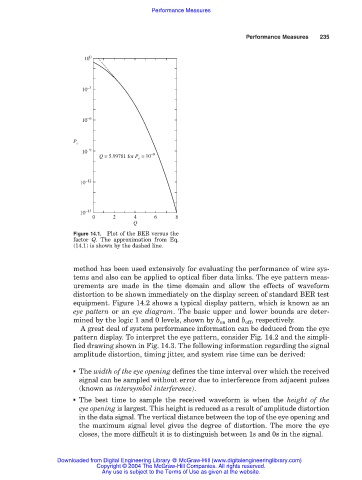
Q = 5.99781 for P e = 10
10 −12
10 −15
0 2 4 6 8
Q
Figure 14.1. Plot of the BER versus the
factor Q. The approximation from Eq.
(14.1) is shown by the dashed line.
method has been used extensively for evaluating the performance of wire sys-
tems and also can be applied to optical fiber data links. The eye pattern meas-
urements are made in the time domain and allow the effects of waveform
distortion to be shown immediately on the display screen of standard BER test
equipment. Figure 14.2 shows a typical display pattern, which is known as an
eye pattern or an eye diagram. The basic upper and lower bounds are deter-
mined by the logic 1 and 0 levels, shown by b on and b off , respectively.
A great deal of system performance information can be deduced from the eye
pattern display. To interpret the eye pattern, consider Fig. 14.2 and the simpli-
fied drawing shown in Fig. 14.3. The following information regarding the signal
amplitude distortion, timing jitter, and system rise time can be derived:
■ The width of the eye opening defines the time interval over which the received
signal can be sampled without error due to interference from adjacent pulses
(known as intersymbol interference).
■ The best time to sample the received waveform is when the height of the
eye opening is largest. This height is reduced as a result of amplitude distortion
in the data signal. The vertical distance between the top of the eye opening and
the maximum signal level gives the degree of distortion. The more the eye
closes, the more difficult it is to distinguish between 1s and 0s in the signal.
Downloaded from Digital Engineering Library @ McGraw-Hill (www.digitalengineeringlibrary.com)
Copyright © 2004 The McGraw-Hill Companies. All rights reserved.
Any use is subject to the Terms of Use as given at the website.