
Page 236 - Optical Switching And Networking Handbook
P. 236
10_200023_CH09/Bates 1/17/01 9:45 AM Page 221
Cost Implications and Financial Trending 221
25
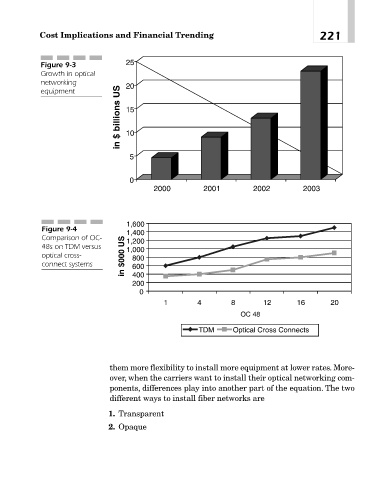
Figure 9-3
Growth in optical
networking 20
in $ billions US 15
equipment
10
5
0
2000 2001 2002 2003
1,600
Figure 9-4
1,400
Comparison of OC- 1,200
48s on TDM versus 1,000
optical cross- in $000 US 800
connect systems 600
400
200
0
1 4 8 12 16 20
OC 48
TDM Optical Cross Connects
them more flexibility to install more equipment at lower rates. More-
over, when the carriers want to install their optical networking com-
ponents, differences play into another part of the equation. The two
different ways to install fiber networks are
1. Transparent
2. Opaque