Page 246 - Optical Switching And Networking Handbook
P. 246

10_200023_CH09/Bates  1/17/01 9:45 AM  Page 231


                    Cost Implications and Financial Trending                                     231


                                           400,000
                    Figure 9-11
                                           350,000
                    Cost model of
                    dedicated fiber        300,000
                    versus DWDM            250,000
                                         Cost  200,000
                    (Scientific Atlanta)
                                           150,000
                                           100,000
                                            50,000
                                                0
                                                       0        30       60       90       120      150
                                                                            Miles

                                                                    DWDM         Dedicated Fiber

                                                                                      Source: Scientific Atlanta


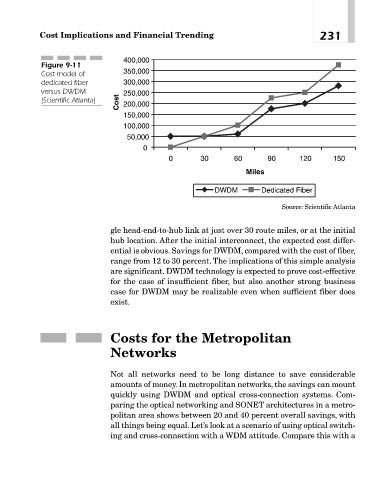
                                       gle head-end-to-hub link at just over 30 route miles, or at the initial
                                       hub location. After the initial interconnect, the expected cost differ-
                                       ential is obvious. Savings for DWDM, compared with the cost of fiber,
                                       range from 12 to 30 percent. The implications of this simple analysis
                                       are significant. DWDM technology is expected to prove cost-effective
                                       for the case of insufficient fiber, but also another strong business
                                       case for DWDM may be realizable even when sufficient fiber does
                                       exist.


                                       Costs for the Metropolitan

                                       Networks


                                       Not all networks need to be long distance to save considerable
                                       amounts of money. In metropolitan networks, the savings can mount
                                       quickly using DWDM and optical cross-connection systems. Com-
                                       paring the optical networking and SONET architectures in a metro-
                                       politan area shows between 20 and 40 percent overall savings, with
                                       all things being equal. Let’s look at a scenario of using optical switch-
                                       ing and cross-connection with a WDM attitude. Compare this with a
   241   242   243   244   245   246   247   248   249   250   251