
Page 106 - Organic Electronics in Sensors and Biotechnology
P. 106
Or ganic Thin-Film Transistors for Inor ganic Substance Monitoring 83
2.4.4 Gas Sensing Results and Perspectives of the Study
Annealed Au-NP layers were used as active material in capacitive
FET sensing devices consisting of p-doped Si semiconductor with a
thermally grown SiO insulating layer. The ohmic backside contact
2
consisted of evaporated, annealed Al. Bonding pads of evaporated
Cr/Au were then deposited on the insulator. The sensor chip, a
ceramic heater, and a Pt-100 element for temperature control were
mounted on a 16-pin holder and then bonded.
A fixed volume (0.5 μL) of the colloidal gold solution was drop-
cast on the SiO surface of the capacitor, partially overlapping the
2
bonding pad and subjected to the thermal heating, prior to gas sens-
ing measurements.
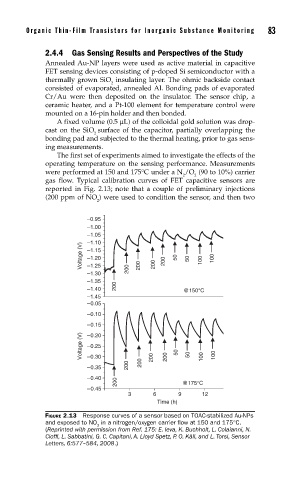
The first set of experiments aimed to investigate the effects of the
operating temperature on the sensing performance. Measurements
were performed at 150 and 175°C under a N /O (90 to 10%) carrier
2 2
gas flow. Typical calibration curves of FET capacitive sensors are
reported in Fig. 2.13; note that a couple of preliminary injections
(200 ppm of NO ) were used to condition the sensor, and then two
2
–0.95
–1.00
–1.05
–1.10
Voltage (V) –1.15 200 50 50 100 100
–1.20
–1.25
–1.30 200 200 200
–1.35
–1.40 200 @150°C
–1.45
–0.05
–0.10
–0.15
Voltage (V) –0.20 50 50 100
–0.25
–0.30
200 200 200 200 100
–0.35
–0.40
200 @175°C
–0.45
3 6 9 12
Time (h)
FIGURE 2.13 Response curves of a sensor based on TOAC-stabilized Au-NPs
and exposed to NO in a nitrogen/oxygen carrier fl ow at 150 and 175°C.
2
(Reprinted with permission from Ref. 175: E. Ieva, K. Buchholt, L. Colaianni, N.
Cioffi , L. Sabbatini, G. C. Capitani, A. Lloyd Spetz, P. O. Käll, and L. Torsi, Sensor
Letters, 6:577–584, 2008.)