
Page 109 - Origin and Prediction of Abnormal Formation Pressures
P. 109
ORIGIN OF FORMATION FLUID PRESSURE DISTRIBUTIONS 89
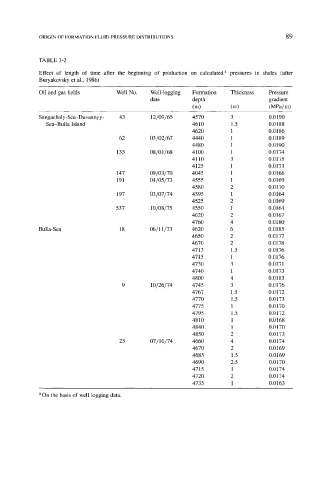
TABLE 3-2
Effect of length of time after the beginning of production on calculated a pressures in shales (after
Buryakovsky et al., 1986)
Oil and gas fields Well No. Well-logging Formation Thickness Pressure
date depth gradient
(m) (m) (MPa/m)
Sangachaly-Sea-Duvannyy- 43 12/09/65 4570 3 0.0190
Sea-Bulla Island 4610 1.5 0.0188
4620 1 0.0186
62 03/02/67 4440 1 0.0189
4480 1 0.0190
135 08/01/68 4100 1 0.0174
4110 3 0.0175
4125 1 0.0173
147 09/03/70 4045 1 0.0166
191 04/05/73 4555 1 0.0169
4580 2 0.0170
197 03/07/74 4595 1 0.0164
4525 2 0.0169
537 10/08/75 4550 1 0.0164
4620 2 0.0167
4760 4 0.0180
Bulla-Sea 18 06/11/73 4620 6 0.0185
4650 2 0.0177
4670 2 0.0178
4713 1.5 0.0176
4715 1 0.0176
4730 3 0.0171
4740 1 0.0173
4800 4 0.0183
9 10/26/74 4745 3 0.0176
4767 1.5 0.0172
4770 1.5 0.0173
4775 1 0.0170
4795 1.5 0.0172
4810 1 0.0168
4840 1 0.0170
4850 2 0.0173
23 07/10/74 4660 4 0.0174
4670 2 0.0169
4685 1.5 0.0169
4690 2.5 0.0170
4715 1 0.0174
4720 2 0.0174
4735 1 0.0163
a On the basis of well logging data.