
Page 195 - Origin and Prediction of Abnormal Formation Pressures
P. 195
170 E AMINZADEH, G.V. CHILINGAR AND J.O. ROBERTSON JR.
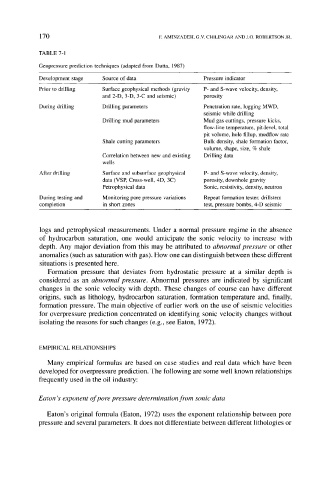
TABLE 7-1
Geopressure prediction techniques (adapted from Dutta, 1987)
Development stage Source of data Pressure indicator
Prior to drilling Surface geophysical methods (gravity P- and S-wave velocity, density,
and 2-D, 3-D, 3-C and seismic) porosity
During drilling Drilling parameters Penetration rate, logging MWD,
seismic while drilling
Drilling mud parameters Mud gas cuttings, pressure kicks,
flow-line temperature, pit-level, total
pit volume, hole fillup, mudflow rate
Shale cutting parameters Bulk density, shale formation factor,
volume, shape, size, % shale
Correlation between new and existing Drilling data
wells
After drilling Surface and subsurface geophysical P- and S-wave velocity, density,
data (VSP, Cross-well, 4D, 3C) porosity, downhole gravity
Petrophysical data Sonic, resistivity, density, neutron
During testing and Monitoring pore pressure variations Repeat formation tester, drillstem
completion in short zones test, pressure bombs, 4-D seismic
logs and petrophysical measurements. Under a normal pressure regime in the absence
of hydrocarbon saturation, one would anticipate the sonic velocity to increase with
depth. Any major deviation from this may be attributed to abnormal pressure or other
anomalies (such as saturation with gas). How one can distinguish between these different
situations is presented here.
Formation pressure that deviates from hydrostatic pressure at a similar depth is
considered as an abnormal pressure. Abnormal pressures are indicated by significant
changes in the sonic velocity with depth. These changes of course can have different
origins, such as lithology, hydrocarbon saturation, formation temperature and, finally,
formation pressure. The main objective of earlier work on the use of seismic velocities
for overpressure prediction concentrated on identifying sonic velocity changes without
isolating the reasons for such changes (e.g., see Eaton, 1972).
EMPIRICAL RELATIONSHIPS
Many empirical formulas are based on case studies and real data which have been
developed for overpressure prediction. The following are some well known relationships
frequently used in the oil industry:
Eaton's exponent of pore pressure determination from sonic data
Eaton's original formula (Eaton, 1972) uses the exponent relationship between pore
pressure and several parameters. It does not differentiate between different lithologies or