Page 228 - Origin and Prediction of Abnormal Formation Pressures
P. 228

202                             G.V. CHILINGAR, W. FERTL, H. RIEKE AND J.O. ROBERTSON JR.
                                  ~,%


                                                      1.0  I.I 1.2  1.3  1.4  Pres/Pah
                             I0
                        ,ooo       20   40   30   60  Rm, ohm'm    9  -  el   I   I   ,'
                                                   <! ti
                                            w
                                  9
                                    i
                                                                         l
                                                       I
                                                                         I
                             13
                                  20
                                                            I  I
                             !1  ,I
                        1500 I~"          /  i          .'1  ,Jr         J
                                                         "I'. I ,115
                                                                         I
                                                                         I
                             II          ~              .'~JJ            j
                        2000  tl        /2";;I           "~''1 ;ik T  6   I  I
                             '"0        '                 ~-I  I        I
                                                          "'
                             I+I
                                                                        :
                        2,oo rl       i  /               ...,,          :
                                                          "  112
                             01~-+-  /22%                               I
                              o
                               ~
                                 ~

                             I
                  s     3~176176 .-!   ..........              ~-~~_
                                                                .,.  ,
                             -v      ,                        I  'T4,
                              *1  J...~0.3%                             I
                                                               -~--~   .-.~,
                                                           WlI"   ,--   1.   I
                                                                        It.I
                                                               9
                                                               9
                                                                        ZI,~I/#
                        4000      ~    *                   !  s 8b~     ,1~  2
                                O0   I  ~   0   0               IlL     I
                        4500     *  '~ *~'~-  **    ,,         '~9      1,3
                                 o~**,  o.~.~.~.
                                                                +
                                  i      ~         -  .    ~  ,I:,~  's   15  '
                        +ooo  -   i';'+~    o   o          ,"J',        ,  I
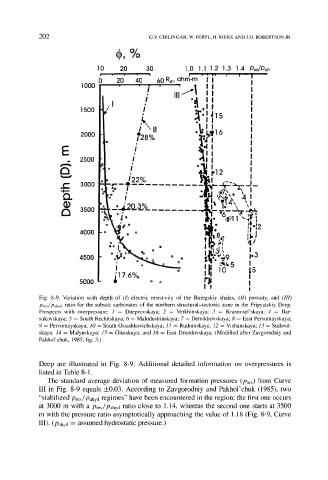
            Fig.  8-9.  Variation  with  depth  of  (/)  electric  resistivity  of  the  Buregskiy  shales,  (II)  porosity,  and  (III)
            Pres/Pahyd  ratio  for  the  subsalt  carbonates  of  the  northern  structural-tectonic  zone  in  the  Pripyatskiy  Deep.
            Prospects  with  overpressure:  1  =  Dneprovskaya;  2  =  Vetkhinskaya;  3  --  Krasnosel'skaya;  4  =  Bar-
            sukovskaya;  5  --  South  Rechitskaya;  6  -  Malodushinskaya;  7  =  Demikhovskaya;  8  --  East  Pervomayskaya;
            9  --  Pervomayskaya;  10 --  South  Ostashkovichskaya;  //=   Rudninskaya;  12  =  Vishanskaya;  13 =  Sudovit-
            skaya;  14  =  Malynskaya;  15  --  Glusskaya;  and  16  =  East  Drozdovskaya.  (Modified  after  Zavgorodniy  and
            Pakhol'chuk,  1985,  fig.  3.)
            Deep  are  illustrated  in  Fig.  8-9.  Additional  detailed  information  on  overpressures  is
            listed in Table 8-1.
               The  standard  average  deviation  of  measured  formation  pressures  (Pr~)  from  Curve
            III  in  Fig.  8-9  equals  +0.03.  According  to  Zavgorodniy  and  Pakhol'chuk  (1985),  two
            "stabilized  Pres/Pahyd  regimes" have been  encountered  in the region"  the first one occurs
            at  3000  m  with  a Pres/Pahyd ratio  close  to  1.14,  whereas  the  second  one  starts  at  3500
            m  with the pressure  ratio asymptotically approaching  the value of  1.18  (Fig.  8-9,  Curve
            III).  (Pahyd  =  assumed hydrostatic pressure.)
   223   224   225   226   227   228   229   230   231   232   233