Page 269 - Origin and Prediction of Abnormal Formation Pressures
P. 269

PORE  WATER  COMPACTION   CHEMISTRY   AS  RELATED  TO  OVERPRESSURES   241
                                   Concentration,  mg/I  x  10,000
                            0     4     8    12    16   20   24    28
                           0                                         0
                              '  '  '  I  '  '  '  I  '  '  '  I  '  '  '  I  '  '  '  I  ....   l  '  '  '
                               ~-----10,000  mg/I
                             .   "'""........   ....               --   1 0 0 0
                                         "'~
                             -                                     -   2000
                                   ",                    ~  ......  TDS
                             -      )-         ..... :o
                                    /          ...-      .......  CI   -   3000
                                              4...
                         1000   _  ,,   /    91          ......  .o+
                                                                   -   4000
                             .ii~ "           ..m        -..,n--  HCO~
                                                                   -   5000
                             _
                             :'.g   .        6....
                     E                                             -   6000   .,_.
                     .ff   2000   .:-:   4  I"   ~   o:-.:',,a            .ff
                                              ~ .....
                                    9
                     D.      "'~   \                   " ........ ~...:,:,   -   7000   ~
                     (b
                     cl                                            -  8000
                             "~i.~  ~   .t  ,        ...'  .......
                             :
                             ~       ,              R"
                             .!                  ~,..~-~           -  9000
                              '    9  *.~  ~  ~   a"""~2   Note  abrupt  change
                         3000   !   ~   ,-~   o- .... :":::~2~   between  normally   -   l  0,000
                             t    r   l   I    ~   /   pressured  Hackberry
                             ,',:j   /    ~       ."   sandstone  and  high
                               9    I                              -   l  1,000
                                .,~  ~            /   pressured  Hackberry
                             :"   ~  ~    1      :"   (Manchester  Field)
                             ._  ;W   WK ~dChestelSS   ~   sandstone   -  12,000
                              9   "
                             '~   /  7  _N   ",.  ~'"o.
                                         ~
                             '4"   i.~l [:::,.Cl ~   berry SS Field   r~ ..... :'.':o~Hackberry SS Field   -  13,000
                             F
                         4000
                             ~                                     -  14,000
                              ,  s   i  11   ,  Manchester SS  le   1111~1   "  "   I   I  I  I
                               '~1
                                            Irlldll
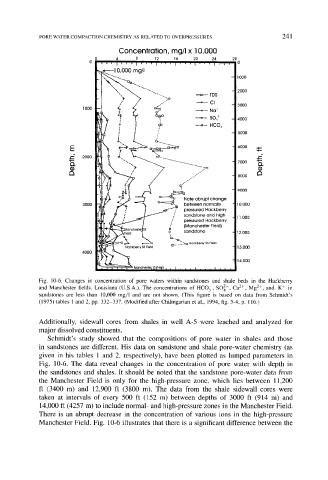
            Fig.  10-6. Changes in  concentration of pore  waters within sandstones and  shale beds  in  the  Hackberry
            and Manchester fields, Louisiana (U.S.A.). The concentrations of HCO~-, SO]-,  Ca 2+, Mg 2+, and, K +  in
            sandstones  are  less than  10,000 mg/1 and  are  not  shown. (This figure is  based  on  data  from  Schmidt's
            (1975) tables 1 and 2, pp. 332-337. (Modified after Chilingarian et al., 1994, fig. 5-4, p.  116.)
            Additionally,  sidewall  cores  from  shales  in  well  A-5  were  leached  and  analyzed  for
            major  dissolved  constituents.
               Schmidt's  study  showed  that  the  compositions  of  pore  water  in  shales  and  those
            in  sandstones  are  different.  His  data  on  sandstone  and  shale  pore-water  chemistry  (as
            given  in  his  tables  1  and  2,  respectively),  have  been  plotted  as  lumped  parameters  in
            Fig.  10-6.  The  data  reveal  changes  in  the  concentration  of  pore  water  with  depth  in
            the  sandstones  and  shales.  It  should  be  noted  that  the  sandstone  pore-water  data  from
            the  Manchester  Field  is  only  for  the  high-pressure  zone,  which  lies  between  11,200
            ft  (3400  m)  and  12,900  ft  (3800  m).  The  data  from  the  shale  sidewall  cores  were
            taken  at  intervals  of  every  500  ft  (152  m)  between  depths  of  3000  ft  (914  m)  and
            14,000  ft (4257  m)  to include  normal-  and  high-pressure  zones  in the Manchester  Field.
            There  is  an  abrupt  decrease  in  the  concentration  of  various  ions  in  the  high-pressure
            Manchester  Field.  Fig.  10-6  illustrates  that  there  is  a  significant  difference  between  the
   264   265   266   267   268   269   270   271   272   273   274