
Page 272 - Origin and Prediction of Abnormal Formation Pressures
P. 272
244 H.H. RIEKE, G.V. CHILINGAR AND J.O. ROBERTSON JR.
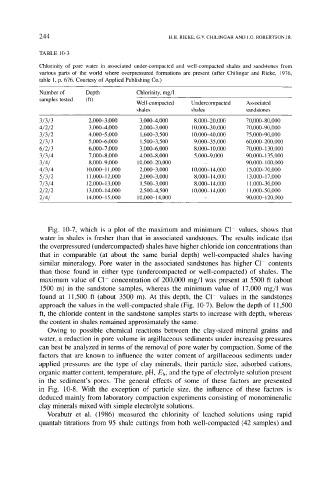
TABLE 10-3
Chlorinity of pore water in associated under-compacted and well-compacted shales and sandstones from
various parts of the world where overpressured formations are present (after Chilingar and Rieke, 1976,
table 1, p. 676. Courtesy of Applied Publishing Co.)
Number of Depth Chlorinity, mg/1
samples tested (ft) Well-compacted Undercompacted Associated
shales shales sandstones
3/3/3 2,000-3,000 3,000-4,000 8,000-20,000 70,000-80,000
4 / 2 / 2 3,000-4,000 2,000-3,000 10,000-30,000 70,000-90,000
3 / 3 / 2 4,000-5,000 1,600-3,500 10,000-40,000 75,000-90,000
2 / 3 / 3 5,000-6,000 1,500-3,500 9,000-35,000 60,000-200,000
6 / 2 / 3 6,000-7,000 3,000-6,000 8,000-10,000 70,000-130,000
3 / 3 / 4 7,000-8,000 4,000-8,000 5,000-9,000 90,000-135,000
3/4/ 8,000-9,000 10,000-20,000 - 90,000-100,000
4/3/4 10,000-11,000 2,000-3,000 10,000-14,000 15,000-70,000
5 / 3 / 2 11,000-12,000 2,000-3,000 8,000-14,000 13,000-17,000
7 / 3/4 12,000-13,000 1,500-3,000 8,000-14,000 11,000-30,000
2 / 2 / 2 13,000-14,000 2,500-4,500 10,000-14,000 11,000-50,000
2/4/ 14,000-15,000 10,000-14,000 - 90,000-120,000
Fig. 10-7, which is a plot of the maximum and minimum CI- values, shows that
water in shales is fresher than that in associated sandstones. The results indicate that
the overpressured (undercompacted) shales have higher chloride ion concentrations than
that in comparable (at about the same burial depth) well-compacted shales having
similar mineralogy. Pore water in the associated sandstones has higher C1- contents
than those found in either type (undercompacted or well-compacted) of shales. The
maximum value of CI- concentration of 200,000 mg/1 was present at 5500 ft (about
1500 m) in the sandstone samples, whereas the minimum value of 17,000 mg/1 was
found at 11,500 ft (about 3500 m). At this depth, the C1- values in the sandstones
approach the values in the well-compacted shale (Fig. 10-7). Below the depth of 11,500
ft, the chloride content in the sandstone samples starts to increase with depth, whereas
the content in shales remained approximately the same.
Owing to possible chemical reactions between the clay-sized mineral grains and
water, a reduction in pore volume in argillaceous sediments under increasing pressures
can best be analyzed in terms of the removal of pore water by compaction. Some of the
factors that are known to influence the water content of argillaceous sediments under
applied pressures are the type of clay minerals, their particle size, adsorbed cations,
organic matter content, temperature, pH, Eh, and the type of electrolyte solution present
in the sediment's pores. The general effects of some of these factors are presented
in Fig. 10-8. With the exception of particle size, the influence of these factors is
deduced mainly from laboratory compaction experiments consisting of monomineralic
clay minerals mixed with simple electrolyte solutions.
Vorabutr et al. (1986) measured the chlorinity of leached solutions using rapid
quantab titrations from 95 shale cuttings from both well-compacted (42 samples) and