Page 275 - Origin and Prediction of Abnormal Formation Pressures
P. 275

PORE WATER COMPACTION CHEMISTRY AS RELATED TO OVERPRESSURES          247
                                   '[    1     l  0   Log-derived  salinities  in
                                   "
                                                     I
                                                                 I
                                                           I
                              2000                clean  sands.
                                                  Lab-measured salinities on
                                                X  sidewall samples from shales
                              3000


                              4000


                              5000
                         ,i,i.-=
                         .ff
                         ,.11.-.
                              6000
                                         :
                              7000   -    R..X
                                           o.
                                         x.X
                              8000                                    .==
                                   --    ;X*'*'*"X ~Top  of overpressured
                                               "
                                              ~
                                        X* .Xx      zone
                                             ,
                              9000
                                           Xo:: ~
                                   _           ~e-~                   _
                             10,000             X'~      ~
                                         l     I     I           I
                                    0   30     50    70    90   110
                                       Salinity,  ppm  x  10 3 NaCI
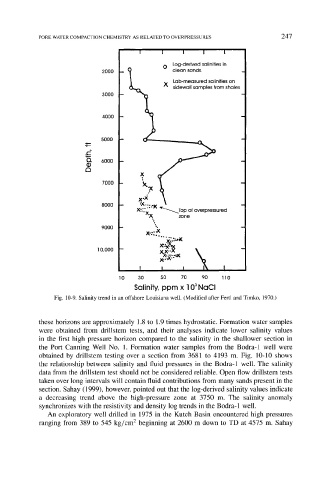
                Fig. 10-9. Salinity trend in an offshore Louisiana well. (Modified after Fertl and Timko, 1970.)


            these horizons are approximately  1.8 to  1.9 times hydrostatic. Formation water samples
            were  obtained  from  drillstem  tests,  and  their  analyses  indicate  lower  salinity  values
            in  the  first  high  pressure  horizon  compared  to  the  salinity  in  the  shallower  section  in
            the  Port  Canning  Well  No.  1.  Formation  water  samples  from  the  Bodra-1  well  were
            obtained  by  drillstem  testing  over  a  section  from  3681  to  4193  m.  Fig.  10-10  shows
            the  relationship  between  salinity  and  fluid  pressures  in  the  Bodra-1  well.  The  salinity
            data from the drillstem test should not be considered reliable.  Open flow drillstem tests
            taken over long intervals will contain fluid contributions from many sands present in the
            section.  Sahay (1999),  however, pointed out that the log-derived salinity values indicate
            a  decreasing  trend  above  the  high-pressure  zone  at  3750  m.  The  salinity  anomaly
            synchronizes with the resistivity and density log trends in the Bodra-1  well.
               An  exploratory  well  drilled  in  1975  in  the  Kutch  Basin  encountered  high  pressures
            ranging  from  389  to  545  kg/cm 2 beginning  at  2600  m  down  to  TD  at 4575  m.  Sahay
   270   271   272   273   274   275   276   277   278   279   280