Page 276 - Origin and Prediction of Abnormal Formation Pressures
P. 276

248                                  H.H. RIEKE, G.V. CHILINGAR AND J.O. ROBERTSON JR.
                                                Pressure,  atms.
                    Age         300      400       500      600       700      800
                                 I        1         I        i         I        I
                                 5        10    Sail, ],~, gms/I-'""   20   25   30
                                 I        I         I         I        I         9
                1000


                1500


               200C
                                                                             /-
                                                                            /
             E                                                              ?
              .. 2500
             (.-.
             CL                                     l                 f
             (I)
             C~
               3000
                            ' w/traces of gas  "~   /                      '
                            rw/t ...... fgas  "~,_   ,,~   I               ~.
                              t
                            d r ~o~ naa?i~a ted ~   ~L  '''~   ~  9-5/8" csg @ 3316 m  .....
                                                               ~
                            ~lt water w/little gas coming out   ~   ~)   7"
               3500                   /     /-  .f  /   ,     /       Normal  pressure
                                             ~    .     A   /              9
                             gas w/sali ....   ter   ~  m  a  l  l  y  -  h  t  g  h  pressure
                            in order to release stuck pipe   /
               4000         :cessful.
                                 No elect, log below 4040 m  salinity data from DST is not  ~',,,,,,~
                            .  ,,.,                    reliable as a long interval
                            / V/  m                    was tested
                                                    9   Casing  shoe
               4500                                II   DST data
                                                 -  -O--   Salinity  curve  drawn  from  DST data
                                                 ---~-   Log  derived  salinity
                                                 --~--   Pressure  in  atms.
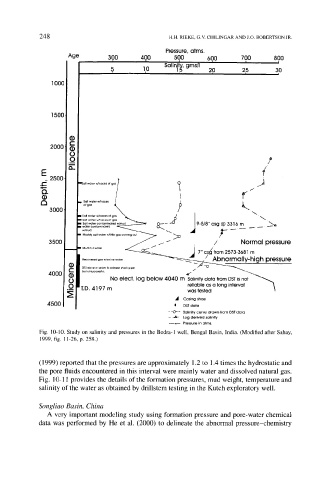
            Fig. 10-10. Study on salinity and pressures in the Bodra-l  well, Bengal Basin, India. (Modified after Sahay,
            1999, fig. 11-26, p. 258.)


            (1999)  reported  that  the  pressures  are  approximately  1.2 to  1.4 times  the hydrostatic  and
            the pore  fluids  encountered  in  this  interval  were  mainly  water  and  dissolved natural  gas.
            Fig.  10-l 1 provides  the  details  of the  formation  pressures,  mud  weight,  temperature  and
            salinity  of the  water  as  obtained  by drillstem  testing  in the  Kutch  exploratory  well.


            Songliao Basin, China
              A  very  important  modeling  study  using  formation  pressure  and  pore-water  chemical
            data  was  performed  by  He  et  al.  (2000)  to  delineate  the  abnormal  pressure-chemistry
   271   272   273   274   275   276   277   278   279   280   281