
Page 32 - Origin and Prediction of Abnormal Formation Pressures
P. 32
INTRODUCTION TO ABNORMALLY PRESSURED FORMATIONS 15
D
O
~
._~ 2 o
C r- . OVERPRESSURE
9 ,I,,,- U'O d-
~~.
/ MAJORITY GULF
r',,," ~ COAST FIELDS A
13 No. MW = .6--
\
",-,99 ~ ,,p.z\ .~
COMMERCIAL \
OIL/GAS FIELDS \ B m o S
~
SMALL t / 3.s \ i _ F~
3 O
~
RESERVOIRS -'~ \ TOP SUPER m ,,,.. ~ >
-4
-(3
oo~e~o,~ ~ NORMAL Rsh \ PRESSURE ~ ~ r-
NO
~r - RESERVOIRS \ ,
,,,., ,,.
iiiiiiiii
Shoff normal resistivity, log Rsh
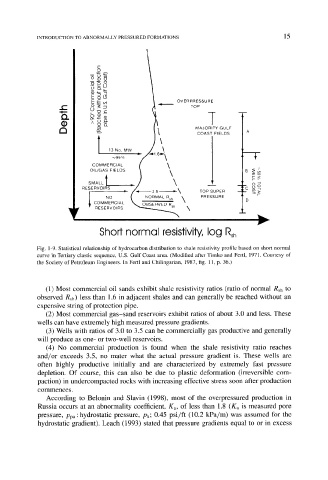
Fig. 1-9. Statistical relationship of hydrocarbon distribution to shale resistivity profile based on short normal
curve in Tertiary clastic sequence, U.S. Gulf Coast area. (Modified after Timko and Fertl, 1971. Courtesy of
the Society of Petroleum Engineers. In Fertl and Chilingarian, 1987, fig. 11, p. 36.)
(1) Most commercial oil sands exhibit shale resistivity ratios (ratio of normal Rsh to
observed Rsh) less than 1.6 in adjacent shales and can generally be reached without an
expensive string of protection pipe.
(2) Most commercial gas-sand reservoirs exhibit ratios of about 3.0 and less. These
wells can have extremely high measured pressure gradients.
(3) Wells with ratios of 3.0 to 3.5 can be commercially gas productive and generally
will produce as one- or two-well reservoirs.
(4) No commercial production is found when the shale resistivity ratio reaches
and/or exceeds 3.5, no mater what the actual pressure gradient is. These wells are
often highly productive initially and are characterized by extremely fast pressure
depletion. Of course, this can also be due to plastic deformation (irreversible com-
paction) in undercompacted rocks with increasing effective stress soon after production
commences.
According to Belonin and Slavin (1998), most of the overpressured production in
Russia occurs at an abnormality coefficient, Ka, of less than 1.8 (Ka is measured pore
pressure, Ppa :hydrostatic pressure, Ph; 0.45 psi/ft (10.2 kPa/m) was assumed for the
hydrostatic gradient). Leach (1993) stated that pressure gradients equal to or in excess