
Page 78 - Origin and Prediction of Abnormal Formation Pressures
P. 78
60 G.V. CHILINGAR, J.O. ROBERTSON JR. AND H.H. RIEKE III
Gradient of movement amplitude, m/km
9 ...: ..:.~ I 9
"".'"':7
9 .'..I~- 0 4 8 12 is 20-a2
9 ~
..~
o'..
9 ', ;
.'.....
o. 9
.';.o
<~..
~
9 '.'].-.;..: ? ;- }.~
,6[
. -,..~
12 . ~ (--,.-
8 114
'- 0 9 9
0
0.9 1.0 1.1 1.2 1.3 1.4
Formation pressure
Hydrostatic pressure
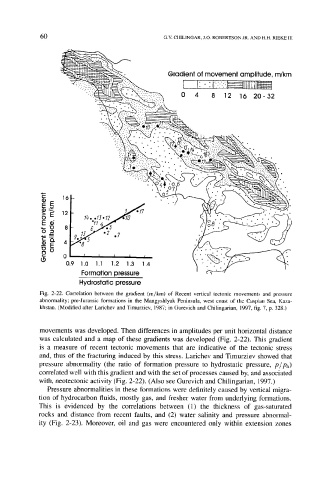
Fig. 2-22. Correlation between the gradient (m/kin) of Recent vertical tectonic movements and pressure
abnormality; pre-Jurassic formations in the Mangyshlyak Peninsula, west coast of the Caspian Sea, Kaza-
khstan. (Modified after Larichev and Timurziev, 1987; in Gurevich and Chilingarian, 1997, fig. 7, p. 328.)
movements was developed. Then differences in amplitudes per unit horizontal distance
was calculated and a map of these gradients was developed (Fig. 2-22). This gradient
is a measure of recent tectonic movements that are indicative of the tectonic stress
and, thus of the fracturing induced by this stress. Larichev and Timurziev showed that
pressure abnormality (the ratio of formation pressure to hydrostatic pressure, p/ph)
correlated well with this gradient and with the set of processes caused by, and associated
with, neotectonic activity (Fig. 2-22). (Also see Gurevich and Chilingarian, 1997.)
Pressure abnormalities in these formations were definitely caused by vertical migra-
tion of hydrocarbon fluids, mostly gas, and fresher water from underlying formations.
This is evidenced by the correlations between (1) the thickness of gas-saturated
rocks and distance from recent faults, and (2) water salinity and pressure abnormal-
ity (Fig. 2-23). Moreover, oil and gas were encountered only within extension zones