
Page 256 - Orlicky's Material Requirements Planning
P. 256
CHAPTER 12 Master Production Schedule 235
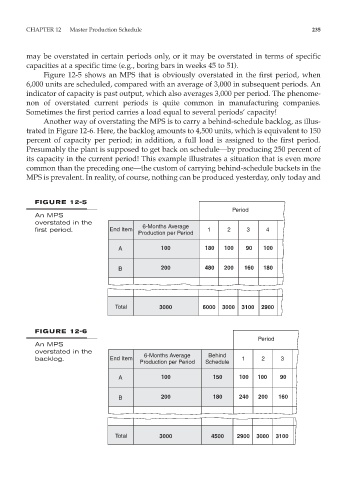
may be overstated in certain periods only, or it may be overstated in terms of specific
capacities at a specific time (e.g., boring bars in weeks 45 to 51).
Figure 12-5 shows an MPS that is obviously overstated in the first period, when
6,000 units are scheduled, compared with an average of 3,000 in subsequent periods. An
indicator of capacity is past output, which also averages 3,000 per period. The phenome-
non of overstated current periods is quite common in manufacturing companies.
Sometimes the first period carries a load equal to several periods’ capacity!
Another way of overstating the MPS is to carry a behind-schedule backlog, as illus-
trated in Figure 12-6. Here, the backlog amounts to 4,500 units, which is equivalent to 150
percent of capacity per period; in addition, a full load is assigned to the first period.
Presumably the plant is supposed to get back on schedule—by producing 250 percent of
its capacity in the current period! This example illustrates a situation that is even more
common than the preceding one—the custom of carrying behind-schedule buckets in the
MPS is prevalent. In reality, of course, nothing can be produced yesterday, only today and
FIGURE 12-5
Period
An MPS
overstated in the
first period. End Item 6-Months Average 1 2 3 4
Production per Period
A 100 180 100 90 100
B 200 480 200 160 180
Total 3000 6000 3000 3100 2900
FIGURE 12-6
Period
An MPS
overstated in the 6-Months Average Behind
backlog. End Item 1 2 3
Production per Period Schedule
A 100 150 100 100 90
B 200 180 240 200 160
Total 3000 4500 2900 3000 3100