
Page 363 - Orlicky's Material Requirements Planning
P. 363
342 PART 3 Managing with the MRP System
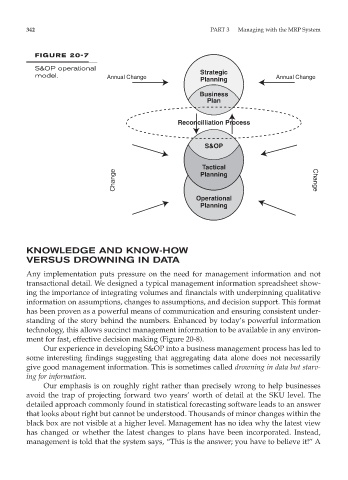
FIGURE 20-7
S&OP operational Strategic
model. Annual Change Planning Annual Change
Business
Plan
Reconcilliation Process
S&OP
Tactical
Change Planning Change
Operational
Planning
KNOWLEDGE AND KNOW-HOW
VERSUS DROWNING IN DATA
Any implementation puts pressure on the need for management information and not
transactional detail. We designed a typical management information spreadsheet show-
ing the importance of integrating volumes and financials with underpinning qualitative
information on assumptions, changes to assumptions, and decision support. This format
has been proven as a powerful means of communication and ensuring consistent under-
standing of the story behind the numbers. Enhanced by today’s powerful information
technology, this allows succinct management information to be available in any environ-
ment for fast, effective decision making (Figure 20-8).
Our experience in developing S&OP into a business management process has led to
some interesting findings suggesting that aggregating data alone does not necessarily
give good management information. This is sometimes called drowning in data but starv-
ing for information.
Our emphasis is on roughly right rather than precisely wrong to help businesses
avoid the trap of projecting forward two years’ worth of detail at the SKU level. The
detailed approach commonly found in statistical forecasting software leads to an answer
that looks about right but cannot be understood. Thousands of minor changes within the
black box are not visible at a higher level. Management has no idea why the latest view
has changed or whether the latest changes to plans have been incorporated. Instead,
management is told that the system says, “This is the answer; you have to believe it!” A