
Page 368 - Orlicky's Material Requirements Planning
P. 368
CHAPTER 20 Sales and Operations Planning 347
but became less profitable because they paid little attention to the cost of responsiveness.
Improving operational effectiveness toward excellence is necessary to achieving superior
profitability and is imperative but not sufficient. In itself, it is not a strategy.
A business with a cost leadership strategy aligns more to the traditional S&OP
process. Managing the portfolio of new activities is a minor role; managing supply,
because it is the biggest cost, has the major role, and the objective is to supply demand at
the lowest cost. Therefore, supply feels the need for S&OP more than most. Eliminating
forecast bias and improving forecast accuracy are the priorities. Other critical success fac-
tors include discipline, efficiency and effectiveness, clearly defined roles, waste elimina-
tion, continuous improvement, and reducing layers in the organization. A single set of
numbers in this environment is appropriate, and executive leadership should be from
finance and supply. Key measurements, in addition to forecast bias and accuracy, are cus-
tomer service to promise, asset utilization, and cost (Figure 20-10).
Customer relationships is a strategy followed by businesses that believe that customer
segmentation and providing a tailored service are the keys to growth and success. S&OP
implementation is led by sales; with strong support from marketing, finance, and the sup-
ply chain, the decision-making process focuses on volume and revenue growth with an
understanding of opportunities and risk—a range of numbers rather than a single set.
Emphasis is on sales planning, with extensive involvement of account managers, promo-
tional activity, and the timely introduction of product-line extensions. High levels of cus-
tomer service and supply-chain responsiveness at minimum cost are standard expectations.
Principal targets include customer retention, revenue, and profit by customer/channel.
In businesses that follow product/service differentiation as a strategy, leadership in
S&OP implementation normally is strategic marketing, with support from research and
development. Strong support is also needed form sales, finance, and the supply chain.
Decision making focuses on volume and margin growth, understanding opportuni-
ties and risks—again, a range of numbers rather than a single set—and in certain cases,
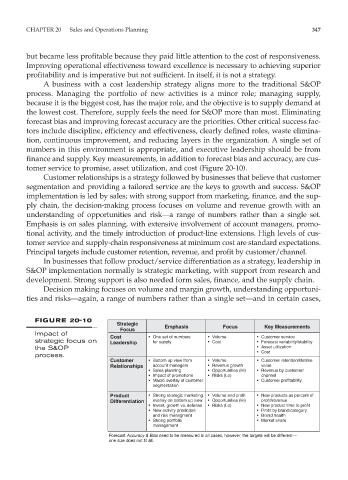
FIGURE 20-10
Strategic Emphasis Focus Key Measurements
Focus
Impact of
Cost • One set of numbers • Volume • Customer service
strategic focus on Leadership for supply • Cost • Forecast variability/stability
the S&OP • Asset utilization
• Cost
process.
Customer • Bottom up view from • Volume • Customer retention/lifetime
Relationships account managers • Revenue growth value
• Sales planning • Opportunities (Hi) • Revenue by customer/
• Impact of promotions • Risks (Lo) channel
• Macro overlay of customer • Customer profitability
segmentation
Product • Strong strategic marketing • Volume and profit • New products as percent of
Differentiation overlay on bottom up view • Opportunities (Hi) profit/revenue
• Invest, growth vs. defense • Risks (Lo) • New product time to profit
• New activity prediction • Profit by brand/category
and risk managment • Brand health
• Strong portfolio • Market share
management
Forecast Accuracy & Bias need to be measured in all cases, however, the targets will be different—
one size does not fit all.