
Page 76 - Orlicky's Material Requirements Planning
P. 76
CHAPTER 4 Inventory in a Manufacturing Environment 57
In the example, demand for the inventory items component to the end product
shows marked discontinuity. Their average inventory level is considerably higher than the
conventional projection of one-half the replenishment lot size plus safety stock. The order-
point system reorders prematurely, way in advance of actual need, and therefore excess
inventory is being carried for long periods of time when there is no real need for it.
The phenomenon of discontinuous demand illustrates the problem of timing of
requirements. Inventory management literature largely concerns itself with problems of
quantity, whereas in the real world of manufacturing the question of timing, rather than
quantity, is of paramount importance. Order point only implies timing, based as it is on
average (past) usage. But average usage data are, for all practical purposes, largely mean-
ingless in an environment of discontinuous, dependent demand.
The example in Figure 4-1 shows graphically that order point, which essentially
assumes continuity of demand subject only to random fluctuation, consequently assumes
also that it is desirable to have at least some inventory on hand at all times and a need to
replenish inventory as soon as it is depleted. When such inventory is subject to discon-
tinuous demand, this is not only unnecessary but also undesirable because it causes infla-
tion of the inventory level.
All three of the inventory items in Figure 4-1 are on order point, but this is not what
causes discontinuity of component demand. It occurs even in the absence of order point
because it is caused, as mentioned previously, by lot sizing at the various stages of man-
ufacture. Where a given component item is subject to dependent demand from multiple
sources (a “common” component), the demand pattern is not only discontinuous but also
nonuniform; that is, the sizes of the lumps tend to be irregular. This is illustrated in the
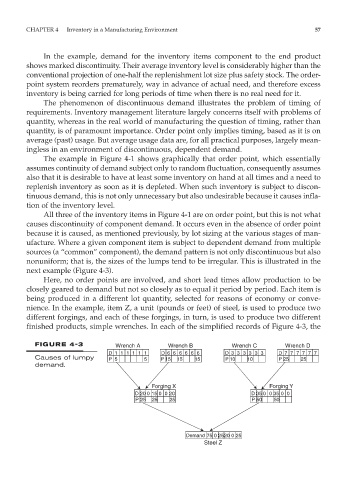
next example (Figure 4-3).
Here, no order points are involved, and short lead times allow production to be
closely geared to demand but not so closely as to equal it period by period. Each item is
being produced in a different lot quantity, selected for reasons of economy or conve-
nience. In the example, item Z, a unit (pounds or feet) of steel, is used to produce two
different forgings, and each of these forgings, in turn, is used to produce two different
finished products, simple wrenches. In each of the simplified records of Figure 4-3, the
FIGURE 4-3 Wrench A Wrench B Wrench C Wrench D
D 1 1 1 1 1 1 D 6 6 6 6 6 6 D 3 3 3 3 3 3 D 7 7 7 7 7 7
Causes of lumpy P 5 5 P 15 15 15 P 10 10 P 25 25
demand.
Forging X Forging Y
D 20 0 15 0 0 20 D 35 0 0 35 0 0
P 25 25 25 P 50 50
Demand 75 0 25 20 0 25
Steel Z