
Page 107 - PVT Property Correlations
P. 107
Wet Gases Chapter | 4 85
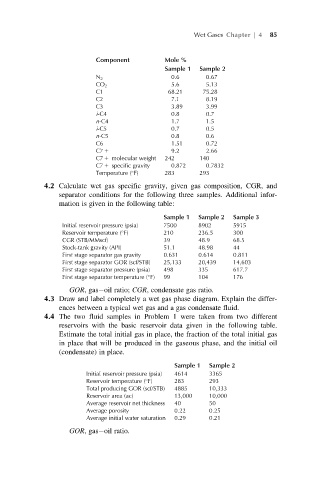
Component Mole %
Sample 1 Sample 2
N 2 0.6 0.67
CO 2 5.6 5.13
C1 68.21 75.28
C2 7.1 8.19
C3 3.89 3.99
i-C4 0.8 0.7
n-C4 1.7 1.5
i-C5 0.7 0.5
n-C5 0.8 0.6
C6 1.51 0.72
C7 1 9.2 2.66
C7 1 molecular weight 242 140
C7 1 specific gravity 0.872 0.7832
Temperature ( F) 283 293
4.2 Calculate wet gas specific gravity, given gas composition, CGR, and
separator conditions for the following three samples. Additional infor-
mation is given in the following table:
Sample 1 Sample 2 Sample 3
Initial reservoir pressure (psia) 7500 8902 5915
Reservoir temperature ( F) 210 236.5 300
CGR (STB/MMscf) 39 48.9 68.5
Stock-tank gravity (API) 51.1 48.98 44
First stage separator gas gravity 0.631 0.614 0.811
First stage separator GOR (scf/STB) 25,133 20,439 14,603
First stage separator pressure (psia) 498 335 617.7
First stage separator temperature ( F) 99 104 176
GOR, gas oil ratio; CGR, condensate gas ratio.
4.3 Draw and label completely a wet gas phase diagram. Explain the differ-
ences between a typical wet gas and a gas condensate fluid.
4.4 The two fluid samples in Problem 1 were taken from two different
reservoirs with the basic reservoir data given in the following table.
Estimate the total initial gas in place, the fraction of the total initial gas
in place that will be produced in the gaseous phase, and the initial oil
(condensate) in place.
Sample 1 Sample 2
Initial reservoir pressure (psia) 4614 3365
Reservoir temperature ( F) 283 293
Total producing GOR (scf/STB) 4885 10,333
Reservoir area (ac) 13,000 10,000
Average reservoir net thickness 40 50
Average porosity 0.22 0.25
Average initial water saturation 0.29 0.21
GOR, gas oil ratio.