
Page 197 - PVT Property Correlations
P. 197
Black Oils Chapter | 7 171
Problem 4—Shifting Calculated PVT Properties
In Problem 2 above, use the known bubble-point pressure value (2635 psia)
and shift R s curve for one of the correlations (McCain, 1991). Compute the
remaining PVT properties using McCain (1991) correlations and apply the
2D shift on the calculated properties. Compare the shifted curves with
the actual values.
Solution of Problem 4
The basic input data was used to compute all PVT properties for pressures
between 100 and 5000 psia. The 2D shifting procedure explained in this
chapter was also used to compute modified values of PVT properties. Both
the un-shifted and shifted values are given in the following plots.
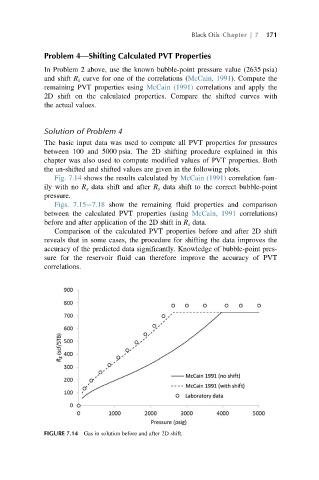
Fig. 7.14 shows the results calculated by McCain (1991) correlation fam-
ily with no R s data shift and after R s data shift to the correct bubble-point
pressure.
Figs. 7.15 7.18 show the remaining fluid properties and comparison
between the calculated PVT properties (using McCain, 1991 correlations)
before and after application of the 2D shift in R s data.
Comparison of the calculated PVT properties before and after 2D shift
reveals that in some cases, the procedure for shifting the data improves the
accuracy of the predicted data significantly. Knowledge of bubble-point pres-
sure for the reservoir fluid can therefore improve the accuracy of PVT
correlations.
FIGURE 7.14 Gas in solution before and after 2D shift.