
Page 195 - PVT Property Correlations
P. 195
Black Oils Chapter | 7 169
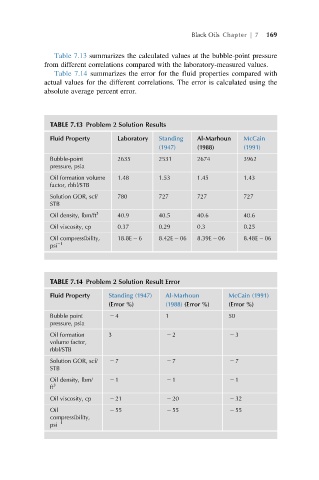
Table 7.13 summarizes the calculated values at the bubble-point pressure
from different correlations compared with the laboratory-measured values.
Table 7.14 summarizes the error for the fluid properties compared with
actual values for the different correlations. The error is calculated using the
absolute average percent error.
TABLE 7.13 Problem 2 Solution Results
Fluid Property Laboratory Standing Al-Marhoun McCain
(1947) (1988) (1991)
Bubble-point 2635 2531 2674 3962
pressure, psia
Oil formation volume 1.48 1.53 1.45 1.43
factor, rbbl/STB
Solution GOR, scf/ 780 727 727 727
STB
Oil density, lbm/ft 3 40.9 40.5 40.6 40.6
Oil viscosity, cp 0.37 0.29 0.3 0.25
Oil compressibility, 18.8E 2 6 8.42E 2 06 8.39E 2 06 8.48E 2 06
psi 21
TABLE 7.14 Problem 2 Solution Result Error
Fluid Property Standing (1947) Al-Marhoun McCain (1991)
(Error %) (1988) (Error %) (Error %)
Bubble point 2 4 1 50
pressure, psia
Oil formation 3 2 2 2 3
volume factor,
rbbl/STB
Solution GOR, scf/ 2 7 2 7 2 7
STB
Oil density, lbm/ 2 1 2 1 2 1
ft 3
Oil viscosity, cp 2 21 2 20 2 32
Oil 2 55 2 55 2 55
compressibility,
psi 21