
Page 191 - PVT Property Correlations
P. 191
Black Oils Chapter | 7 165
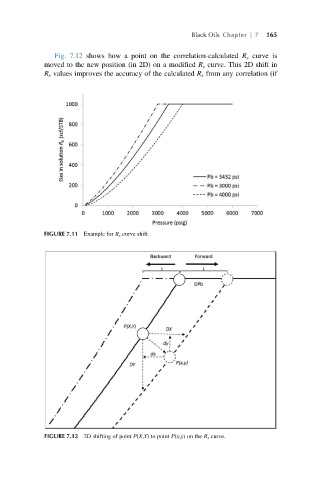
Fig. 7.12 shows how a point on the correlation-calculated R s curve is
moved to the new position (in 2D) on a modified R s curve. This 2D shift in
R s values improves the accuracy of the calculated R s from any correlation (if
FIGURE 7.11 Example for R s curve shift.
FIGURE 7.12 2D shifting of point P(X,Y) to point P(x,y) on the R s curve.